The NIH/NIGMS
Center for Integrative Biomedical Computing

SCI Publications

2012


J.R. Bronson, J.A. Levine, R.T. Whitaker. “Lattice Cleaving: Conforming Tetrahedral Meshes of Multimaterial Domains with Bounded Quality,” In Proceedings of the 21st International Meshing Roundtable, pp. 191--209. 2012.

ABSTRACT

We introduce a new algorithm for generating tetrahedral meshes that conform to physical boundaries in volumetric domains consisting of multiple materials. The proposed method allows for an arbitrary number of materials, produces high-quality tetrahedral meshes with upper and lower bounds on dihedral angles, and guarantees geometric delity. Moreover, the method is combinatoric so its implementation enables rapid mesh construction. These meshes are structured in a way that also allows grading, in order to reduce element counts in regions of homogeneity.


J.R. Bronson, J.A. Levine, R.T. Whitaker. 
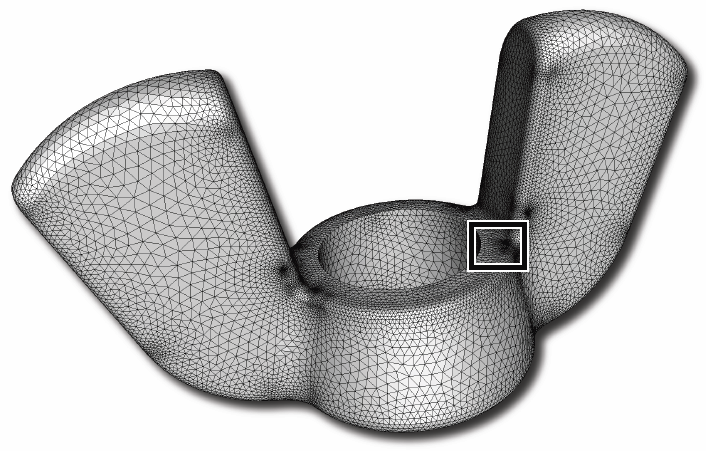
“Particle Systems for Adaptive, Isotropic Meshing of CAD Models,” In Engineering with Computers, Vol. 28, No. 4, pp. 331--344. 2012.
PubMed ID: 23162181
PubMed Central ID: PMC3499137

ABSTRACT

We present a particle-based approach for generating adaptive triangular surface and tetrahedral volume meshes from computer-aided design models. Input shapes are treated as a collection of smooth, parametric surface patches that can meet non-smoothly on boundaries. Our approach uses a hierarchical sampling scheme that places particles on features in order of increasing dimensionality. These particles reach a good distribution by minimizing an energy computed in 3D world space, with movements occurring in the parametric space of each surface patch. Rather than using a pre-computed measure of feature size, our system automatically adapts to both curvature as well as a notion of topological separation. It also enforces a measure of smoothness on these constraints to construct a sizing field that acts as a proxy to piecewise-smooth feature size. We evaluate our technique with comparisons against other popular triangular meshing techniques for this domain.


C. Butson, G. Tamm, S. Jain, T. Fogal, J. Krüger. “Evaluation of Interactive Visualization on Mobile Computing Platforms for Selection of Deep Brain Stimulation Parameters,” In IEEE Transactions on Visualization and Computer Graphics, pp. (accepted). 2012.
ISSN: 1077-2626
DOI: 10.1109/TVCG.2012.92

ABSTRACT

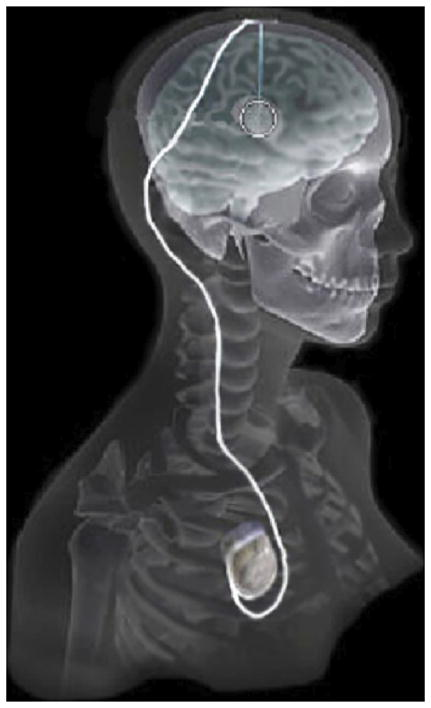
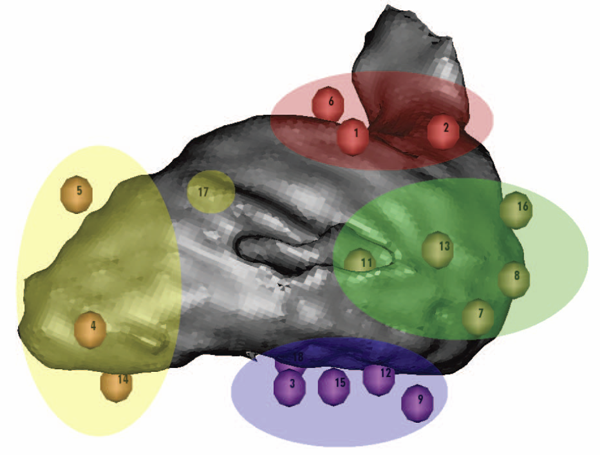
In recent years there has been significant growth in the use of patient-specific models to predict the effects of deep brain stimulation (DBS). However, translating these models from a research environment to the everyday clinical workflow has been a challenge. In this paper, we deploy the interactive visualization system ImageVis3D Mobile in an evaluation environment to visualize models of Parkinson’s disease patients who received DBS therapy. We used ImageVis3D Mobile to provide models to movement disorders clinicians and asked them to use the software to determine: 1) which of the four DBS electrode contacts they would select for therapy; and 2) what stimulation settings they would choose. We compared the stimulation protocol chosen from the software versus the stimulation protocol that was chosen via clinical practice (independently of the study). Lastly, we compared the amount of time required to reach these settings using the software versus the time required through standard practice. We found that the stimulation settings chosen using ImageVis3D Mobile were similar to those used in standard of care, but were selected in drastically less time. We show how our visualization system can be used to guide clinical decision making for selection of DBS settings.

Keywords: scidac, dbs


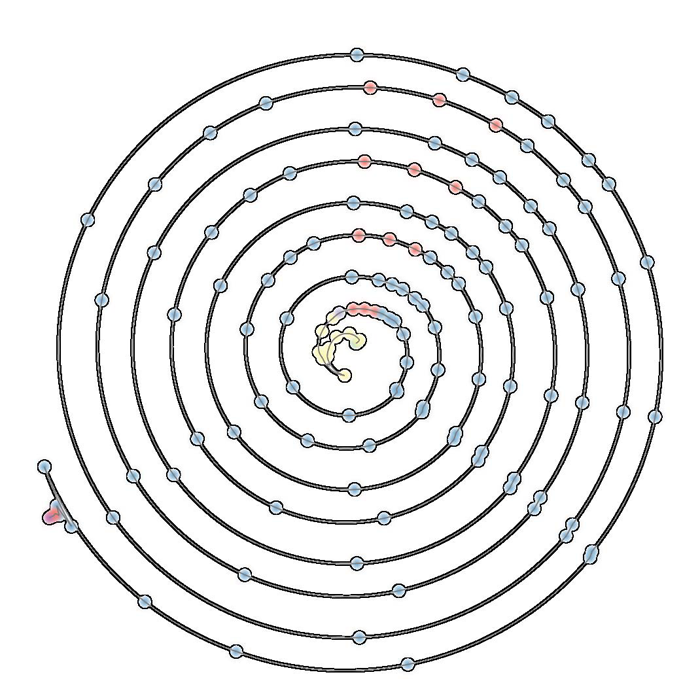
A.N.M. Imroz Choudhury, Bei Wang, P. Rosen, V. Pascucci. “Topological Analysis and Visualization of Cyclical Behavior in Memory Reference Traces,” In Proceedings of the IEEE Pacific Visualization Symposium (PacificVis 2012), pp. 9--16. 2012.
DOI: 10.1109/PacificVis.2012.6183557

ABSTRACT

We demonstrate the application of topological analysis techniques to the rather unexpected domain of software visualization. We collect a memory reference trace from a running program, recasting the linear flow of trace records as a high-dimensional point cloud in a metric space. We use topological persistence to automatically detect significant circular structures in the point cloud, which represent recurrent or cyclical runtime program behaviors. We visualize such recurrences using radial plots to display their time evolution, offering multi-scale visual insights, and detecting potential candidates for memory performance optimization. We then present several case studies to demonstrate some key insights obtained using our techniques.

Keywords: scidac


M. Dannhauer, D.H. Brooks, D. Tucker, R.S. MacLeod. “A pipeline for the simulation of transcranial direct current stimulation for realistic human head models using SCIRun/BioMesh3D,” In Proceedings of the 2012 IEEE Int. Conf. Engineering and Biology Society (EMBC), pp. 5486--5489. 2012.
DOI: 10.1109/EMBC.2012.6347236
PubMed ID: 23367171
PubMed Central ID: PMC3651514

ABSTRACT

The current work presents a computational pipeline to simulate transcranial direct current stimulation from image based models of the head with SCIRun [15]. The pipeline contains all the steps necessary to carry out the simulations and is supported by a complete suite of open source software tools: image visualization, segmentation, mesh generation, tDCS electrode generation and efficient tDCS forward simulation.


M. Datar, P. Muralidharan, A. Kumar, S. Gouttard, J. Piven, G. Gerig, R.T. Whitaker, P.T. Fletcher. “Mixed-Effects Shape Models for Estimating Longitudinal Changes in Anatomy,” In Spatio-temporal Image Analysis for Longitudinal and Time-Series Image Data, Lecture Notes in Computer Science, Vol. 7570, Springer Berlin / Heidelberg, pp. 76--87. 2012.
ISBN: 978-3-642-33554-9
DOI: 10.1007/978-3-642-33555-6_7

ABSTRACT

In this paper, we propose a new method for longitudinal shape analysis that ts a linear mixed-e ects model, while simultaneously optimizing correspondences on a set of anatomical shapes. Shape changes are modeled in a hierarchical fashion, with the global population trend as a xed e ect and individual trends as random e ects. The statistical signi cance of the estimated trends are evaluated using speci cally designed permutation tests. We also develop a permutation test based on the Hotelling T2 statistic to compare the average shapes trends between two populations. We demonstrate the bene ts of our method on a synthetic example of longitudinal tori and data from a developmental neuroimaging study.

Keywords: Computer Science


B. Erem, P. Stovicek, D.H. Brooks. “Manifold learning for analysis of low-order nonlinear dynamics in high-dimensional electrocardiographic signals,” In Proceedings of the 9th IEEE International Symposium on Biomedical Imaging (ISBI), pp. 844--847. 2012.
DOI: 10.1109/ISBI.2012.6235680

ABSTRACT

The dynamical structure of electrical recordings from the heart or torso surface is a valuable source of information about cardiac physiological behavior. In this paper, we use an existing data-driven technique for manifold identification to reveal electrophysiologically significant changes in the underlying dynamical structure of these signals. Our results suggest that this analysis tool characterizes and differentiates important parameters of cardiac bioelectric activity through their dynamic behavior, suggesting the potential to serve as an effective dynamic constraint in the context of inverse solutions.


F.N. Golabchi, D.H. Brooks. “Axon segmentation in microscopy images - A graphical model based approach,” In Proceedings of the 9th IEEE International Symposium on Biomedical Imaging (ISBI), pp. 756-759. 2012.
DOI: 10.1109/ISBI.2012.6235658

ABSTRACT

Image segmentation of very large and complex microscopy images are challenging due to variability in the images and the need for algorithms to be robust, fast and able to incorporate various types of information and constraints in the segmentation model. In this paper we propose a graphical model based image segmentation framework that combines the information in images regions with the information in their boundary in a unified probabilistic formulation.


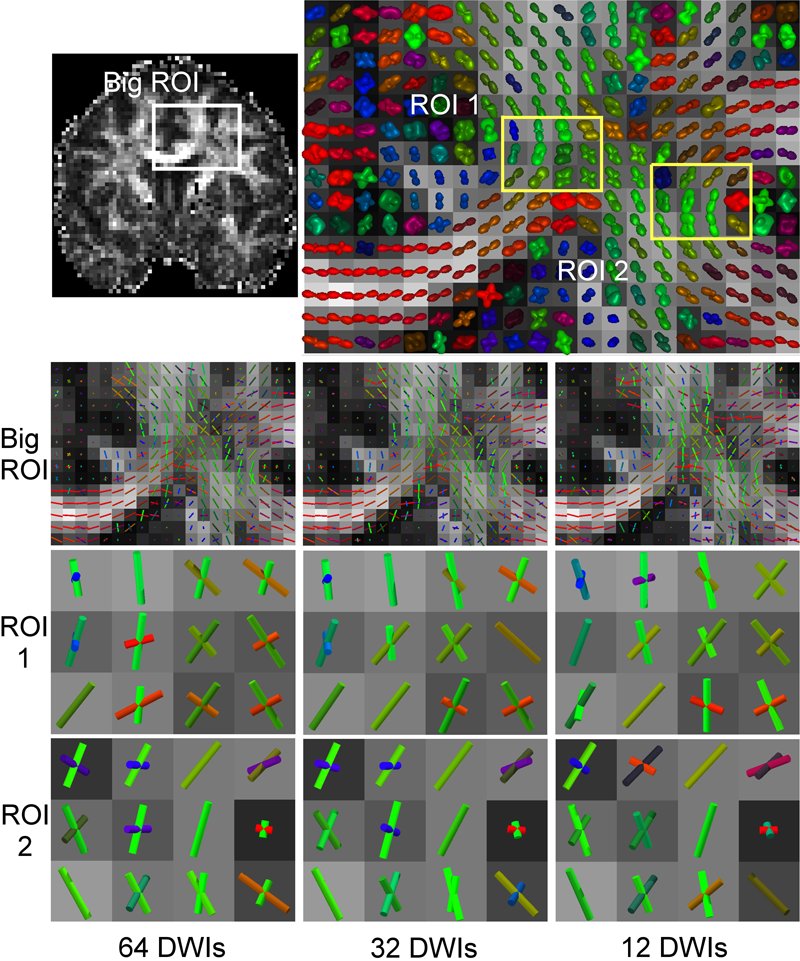
Y. Gur, F. Jiao, S.X. Zhu, C.R. Johnson. “White matter structure assessment from reduced HARDI data using low-rank polynomial approximations,” In Proceedings of MICCAI 2012 Workshop on Computational Diffusion MRI (CDMRI12), Nice, France, Lecture Notes in Computer Science (LNCS), pp. 186-197. October, 2012.

ABSTRACT

Assessing white matter fiber orientations directly from DWI measurements in single-shell HARDI has many advantages. One of these advantages is the ability to model multiple fibers using fewer parameters than are required to describe an ODF and, thus, reduce the number of DW samples needed for the reconstruction. However, fitting a model directly to the data using Gaussian mixture, for instance, is known as an initialization-dependent unstable process. This paper presents a novel direct fitting technique for single-shell HARDI that enjoys the advantages of direct fitting without sacrificing the accuracy and stability even when the number of gradient directions is relatively low. This technique is based on a spherical deconvolution technique and decomposition of a homogeneous polynomial into a sum of powers of linear forms, known as a symmetric tensor decomposition. The fiber-ODF (fODF), which is described by a homogeneous polynomial, is approximated here by a discrete sum of even-order linear-forms that are directly related to rank-1 tensors and represent single-fibers. This polynomial approximation is convolved to a single-fiber response function, and the result is optimized against the DWI measurements to assess the fiber orientations and the volume fractions directly. This formulation is accompanied by a robust iterative alternating numerical scheme which is based on the Levenberg- Marquardt technique. Using simulated data and in vivo, human brain data we show that the proposed algorithm is stable, accurate and can model complex fiber structures using only 12 gradient directions.


C.R. Johnson. “Biomedical Visual Computing: Case Studies and Challenges,” In IEEE Computing in Science and Engineering, Vol. 14, No. 1, pp. 12--21. 2012.
PubMed ID: 22545005
PubMed Central ID: PMC3336198

ABSTRACT

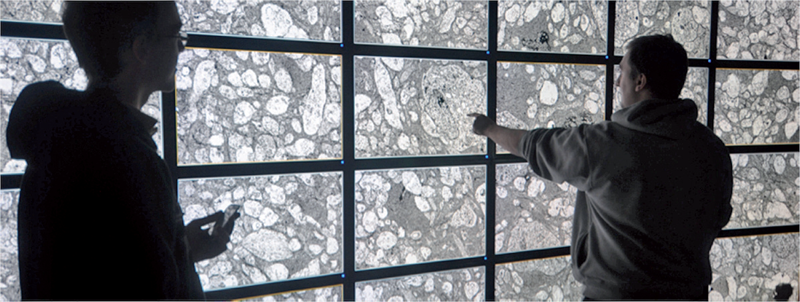
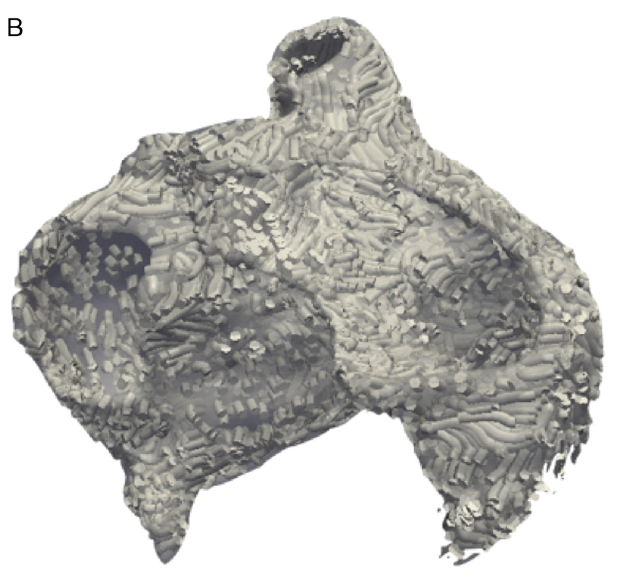
Computer simulation and visualization are having a substantial impact on biomedicine and other areas of science and engineering. Advanced simulation and data acquisition techniques allow biomedical researchers to investigate increasingly sophisticated biological function and structure. A continuing trend in all computational science and engineering applications is the increasing size of resulting datasets. This trend is also evident in data acquisition, especially in image acquisition in biology and medical image databases.

For example, in a collaboration between neuroscientist Robert Marc and our research team at the University of Utah's Scientific Computing and Imaging (SCI) Institute (www.sci.utah.edu), we're creating datasets of brain electron microscopy (EM) mosaics that are 16 terabytes in size. However, while there's no foreseeable end to the increase in our ability to produce simulation data or record observational data, our ability to use this data in meaningful ways is inhibited by current data analysis capabilities, which already lag far behind. Indeed, as the NIH-NSF Visualization Research Challenges report notes, to effectively understand and make use of the vast amounts of data researchers are producing is one of the greatest scientific challenges of the 21st century.

Visual data analysis involves creating images that convey salient information about underlying data and processes, enabling the detection and validation of expected results while leading to unexpected discoveries in science. This allows for the validation of new theoretical models, provides comparison between models and datasets, enables quantitative and qualitative querying, improves interpretation of data, and facilitates decision making. Scientists can use visual data analysis systems to explore \"what if\" scenarios, define hypotheses, and examine data under multiple perspectives and assumptions. In addition, they can identify connections between numerous attributes and quantitatively assess the reliability of hypotheses. In essence, visual data analysis is an integral part of scientific problem solving and discovery.

As applied to biomedical systems, visualization plays a crucial role in our ability to comprehend large and complex data-data that, in two, three, or more dimensions, convey insight into many diverse biomedical applications, including understanding neural connectivity within the brain, interpreting bioelectric currents within the heart, characterizing white-matter tracts by diffusion tensor imaging, and understanding morphology differences among different genetic mice phenotypes.

Keywords: kaust


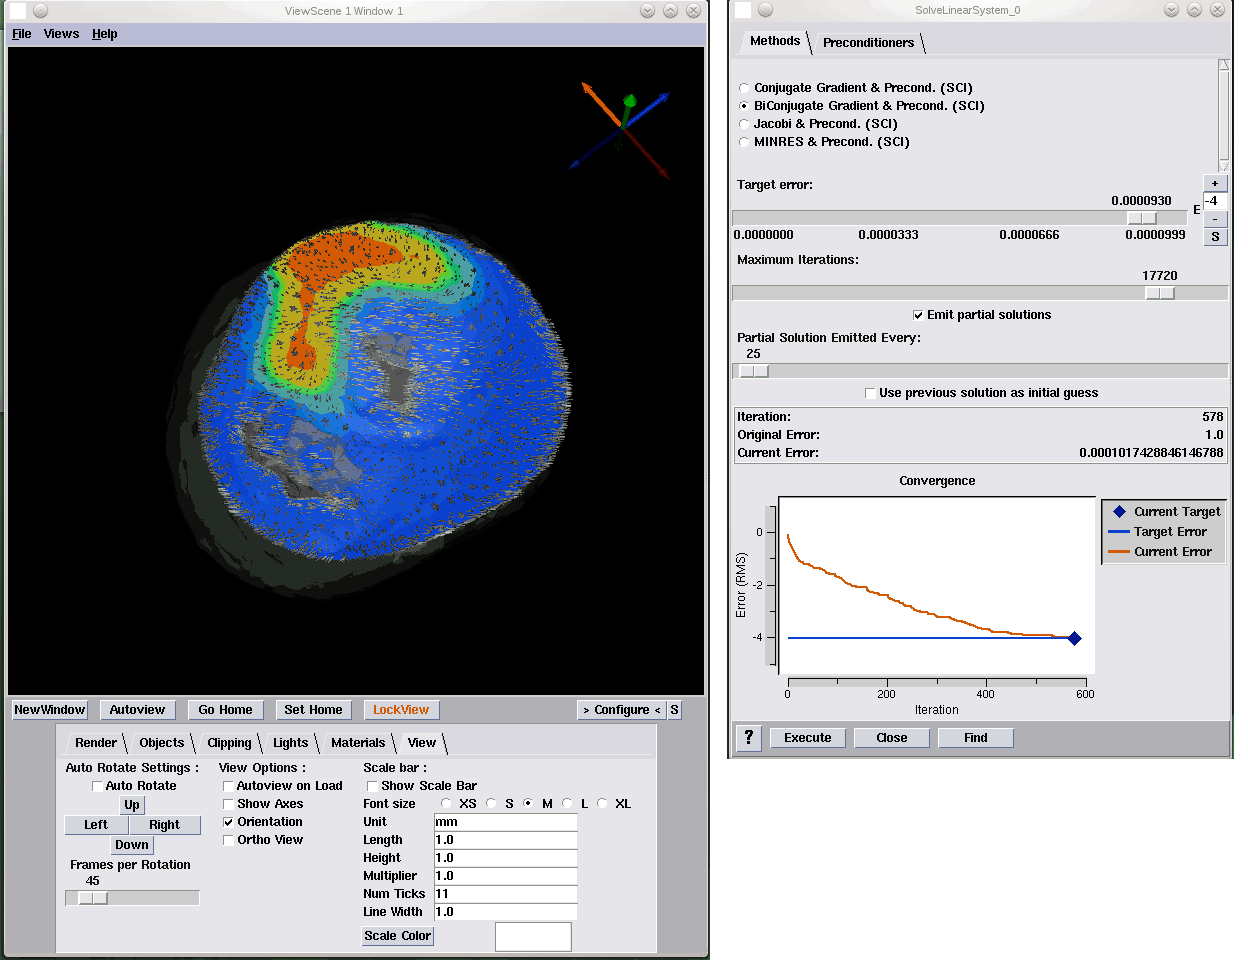
J. Knezevic, R.-P. Mundani, E. Rank, A. Khan, C.R. Johnson. “Extending the SCIRun Problem Solving Environment to Large-Scale Applications,” In Proceedings of Applied Computing 2012, IADIS, pp. 171--178. October, 2012.

ABSTRACT

To make the most of current advanced computing technologies, experts in particular areas of science and engineering should be supported by sophisticated tools for carrying out computational experiments. The complexity of individual components of such tools should be hidden from them so they may concentrate on solving the specific problem within their field of expertise. One class of such tools are Problem Solving Environments (PSEs). The contribution of this paper refers to the idea of integration of an interactive computing framework applicable to different engineering applications into the SCIRun PSE in order to enable interactive real-time response of the computational model to user interaction even for large-scale problems. While the SCIRun PSE allows for real-time computational steering, we propose extending this functionality to a wider range of applications and larger scale problems. With only minor code modifications the proposed system allows each module scheduled for execution in a dataflow-based simulation to be automatically interrupted and re-scheduled. This rescheduling allows one to keep the relation between the user interaction and its immediate effect transparent independent of the problem size, thus, allowing for the intuitive and interactive exploration of simulation results.

Keywords: scirun


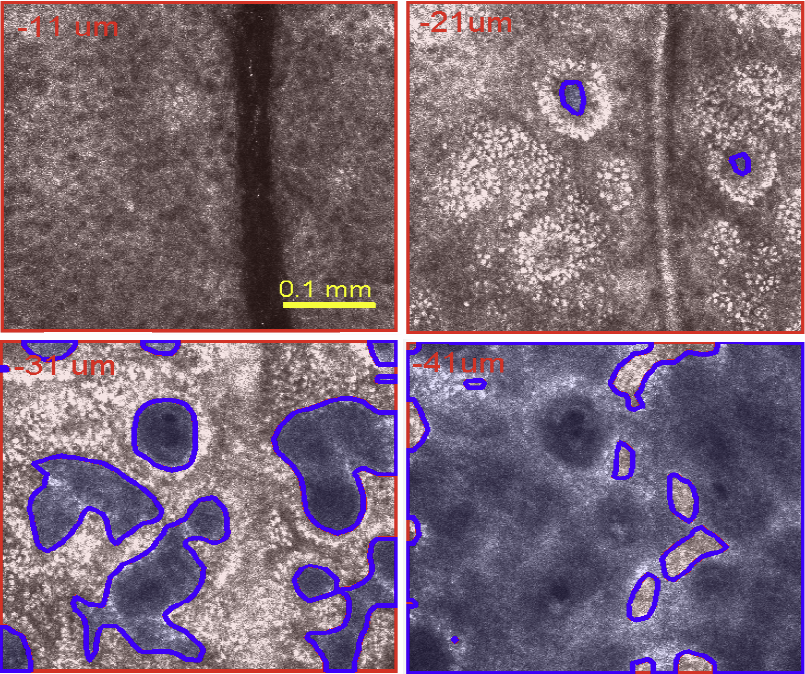
S. Kurugol, M. Rajadhyaksha, J.G. Dy, D.H. Brooks. “Validation study of automated dermal/epidermal junction localization algorithm in reflectance confocal microscopy images of skin,” In Proceedings of SPIE Photonic Therapeutics and Diagnostics VIII, Vol. 8207, No. 1, pp. 820702-820711. 2012.
DOI: 10.1117/12.909227
PubMed ID: 24376908
PubMed Central ID: PMC3872972

ABSTRACT

Reflectance confocal microscopy (RCM) has seen increasing clinical application for noninvasive diagnosis of skin cancer. Identifying the location of the dermal-epidermal junction (DEJ) in the image stacks is key for effective clinical imaging. For example, one clinical imaging procedure acquires a dense stack of 0.5x0.5mm FOV images and then, after manual determination of DEJ depth, collects a 5x5mm mosaic at that depth for diagnosis. However, especially in lightly pigmented skin, RCM images have low contrast at the DEJ which makes repeatable, objective visual identification challenging. We have previously published proof of concept for an automated algorithm for DEJ detection in both highly- and lightly-pigmented skin types based on sequential feature segmentation and classification. In lightly-pigmented skin the change of skin texture with depth was detected by the algorithm and used to locate the DEJ. Here we report on further validation of our algorithm on a more extensive collection of 24 image stacks (15 fair skin, 9 dark skin). We compare algorithm performance against classification by three clinical experts. We also evaluate inter-expert consistency among the experts. The average correlation across experts was 0.81 for lightly pigmented skin, indicating the difficulty of the problem. The algorithm achieved epidermis/dermis misclassification rates smaller than 10% (based on 25x25 mm tiles) and average distance from the expert labeled boundaries of ~6.4 ?m for fair skin and ~5.3 ?m for dark skin, well within average cell size and less than 2x the instrument resolution in the optical axis.


K.S. McDowell, F. Vadakkumpadan, R. Blake, J. Blauer, G. Plank, R.S. MacLeod, N.A. Trayanova. “Methodology for patient-specific modeling of atrial fibrosis as a substrate for atrial fibrillation,” In Journal of Electrocardiology, Vol. 45, No. 6, pp. 640--645. 2012.
DOI: 10.1016/j.jelectrocard.2012.08.005
PubMed ID: 22999492
PubMed Central ID: PMC3515859

ABSTRACT

Personalized computational cardiac models are emerging as an important tool for studying cardiac arrhythmia mechanisms, and have the potential to become powerful instruments for guiding clinical anti-arrhythmia therapy. In this article, we present the methodology for constructing a patient-specific model of atrial fibrosis as a substrate for atrial fibrillation. The model is constructed from high-resolution late gadolinium-enhanced magnetic resonance imaging (LGE-MRI) images acquired in vivo from a patient suffering from persistent atrial fibrillation, accurately capturing both the patient's atrial geometry and the distribution of the fibrotic regions in the atria. Atrial fiber orientation is estimated using a novel image-based method, and fibrosis is represented in the patient-specific fibrotic regions as incorporating collagenous septa, gap junction remodeling, and myofibroblast proliferation. A proof-of-concept simulation result of reentrant circuits underlying atrial fibrillation in the model of the patient's fibrotic atrium is presented to demonstrate the completion of methodology development.

Keywords: Patient-specific modeling, Computational model, Atrial fibrillation, Atrial fibrosis


Q. Meng, J. Hall, H. Rutigliano, X. Zhou, B.R. Sessions, R. Stott, K. Panter, C.J. Davies, R. Ranjan, D. Dosdall, R.S. MacLeod, N. Marrouche, K.L. White, Z. Wang, I.A. Polejaeva. “30 Generation of Cloned Transgenic Goats with Cardiac Specific Overexpression of Transforming Growth Factor β1,” In Reproduction, Fertility and Development, Vol. 25, No. 1, pp. 162--163. 2012.
DOI: 10.1071/RDv25n1Ab30

ABSTRACT

Transforming growth factor β1 (TGF-β1) has a potent profibrotic function and is central to signaling cascades involved in interstitial fibrosis, which plays a critical role in the pathobiology of cardiomyopathy and contributes to diastolic and systolic dysfunction. In addition, fibrotic remodeling is responsible for generation of re-entry circuits that promote arrhythmias (Bujak and Frangogiannis 2007 Cardiovasc. Res. 74, 184–195). Due to the small size of the heart, functional electrophysiology of transgenic mice is problematic. Large transgenic animal models have the potential to offer insights into conduction heterogeneity associated with fibrosis and the role of fibrosis in cardiovascular diseases. The goal of this study was to generate transgenic goats overexpressing an active form of TGFβ-1 under control of the cardiac-specific α-myosin heavy chain promoter (α-MHC). A pcDNA3.1DV5-MHC-TGF-β1cys33ser vector was constructed by subcloning the MHC-TGF-β1 fragment from the plasmid pUC-BM20-MHC-TGF-β1 (Nakajima et al. 2000 Circ. Res. 86, 571–579) into the pcDNA3.1D V5 vector. The Neon transfection system was used to electroporate primary goat fetal fibroblasts. After G418 selection and PCR screening, transgenic cells were used for SCNT. Oocytes were collected by slicing ovaries from an abattoir and matured in vitro in an incubator with 5\% CO2 in air. Cumulus cells were removed at 21 to 23 h post-maturation. Oocytes were enucleated by aspirating the first polar body and nearby cytoplasm by micromanipulation in Hepes-buffered SOF medium with 10 µg of cytochalasin B mL–1. Transgenic somatic cells were individually inserted into the perivitelline space and fused with enucleated oocytes using double electrical pulses of 1.8 kV cm–1 (40 µs each). Reconstructed embryos were activated by ionomycin (5 min) and DMAP and cycloheximide (CHX) treatments. Cloned embryos were cultured in G1 medium for 12 to 60 h in vitro and then transferred into synchronized recipient females. Pregnancy was examined by ultrasonography on day 30 post-transfer. A total of 246 cloned embryos were transferred into 14 recipients that resulted in production of 7 kids. The pregnancy rate was higher in the group cultured for 12 h compared with those cultured 36 to 60 h [44.4\% (n = 9) v. 20\% (n = 5)]. The kidding rates per embryo transferred of these 2 groups were 3.8\% (n = 156) and 1.1\% (n = 90), respectively. The PCR results confirmed that all the clones were transgenic. Phenotype characterization [e.g. gene expression, electrocardiogram (ECG), and magnetic resonance imaging (MRI)] is underway. We demonstrated successful production of transgenic goat via SCNT. To our knowledge, this is the first transgenic goat model produced for cardiovascular research.


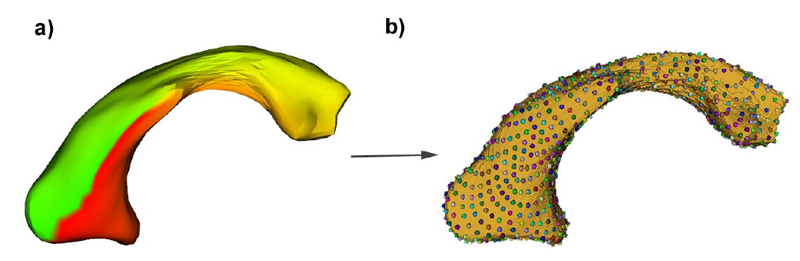
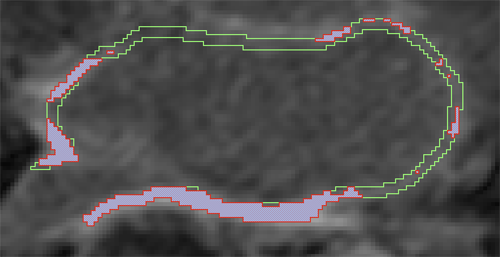
B. Paniagua, L. Bompard, J. Cates, R.T. Whitaker, M. Datar, C. Vachet, M. Styner. “Combined SPHARM-PDM and entropy-based particle systems shape analysis framework,” In Medical Imaging 2012: Biomedical Applications in Molecular, Structural, and Functional Imaging, SPIE Intl Soc Optical Eng, March, 2012.
DOI: 10.1117/12.911228
PubMed ID: 24027625
PubMed Central ID: PMC3766973

ABSTRACT

Description of purpose: The NA-MIC SPHARM-PDM Toolbox represents an automated set of tools for the computation of 3D structural statistical shape analysis. SPHARM-PDM solves the correspondence problem by defining a first order ellipsoid aligned, uniform spherical parameterization for each object with correspondence established at equivalently parameterized points. However, SPHARM correspondence has shown to be inadequate for some biological shapes that are not well described by a uniform spherical parameterization. Entropy-based particle systems compute correspondence by representing surfaces as discrete point sets that does not rely on any inherent parameterization. However, they are sensitive to initialization and have little ability to recover from initial errors. By combining both methodologies we compute reliable correspondences in topologically challenging biological shapes. Data: Diverse subcortical structures cohorts were used, obtained from MR brain images. Method(s): The SPHARM-PDM shape analysis toolbox was used to compute point based correspondent models that were then used as initializing particles for the entropy-based particle systems. The combined framework was implemented as a stand-alone Slicer3 module, which works as an end-to-end shape analysis module. Results: The combined SPHARM-PDM-Particle framework has demonstrated to improve correspondence in the example dataset over the conventional SPHARM-PDM toolbox. Conclusions: The work presented in this paper demonstrates a two-sided improvement for the scientific community, being able to 1) find good correspondences among spherically topological shapes, that can be used in many morphometry studies 2) offer an end-to-end solution that will facilitate the access to shape analysis framework to users without computer expertise.


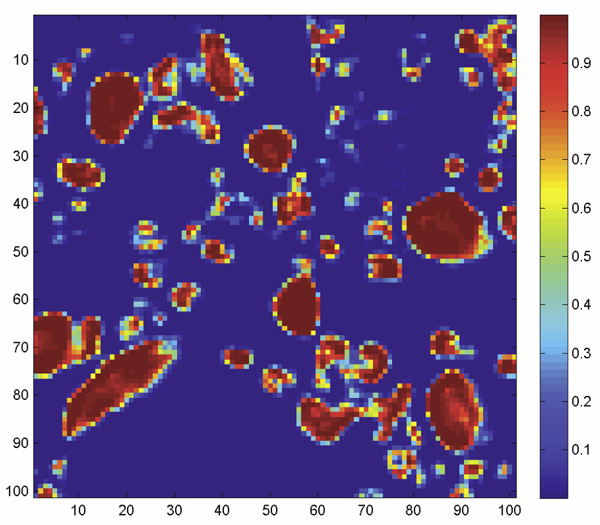
D. Perry, A. Morris, N. Burgon, C. McGann, R.S. MacLeod, J. Cates. “Automatic classification of scar tissue in late gadolinium enhancement cardiac MRI for the assessment of left-atrial wall injury after radiofrequency ablation,” In SPIE Proceedings, Vol. 8315, pp. (published online). 2012.
DOI: 10.1117/12.910833
PubMed ID: 24236224
PubMed Central ID: PMC3824273

ABSTRACT

Radiofrequency ablation is a promising procedure for treating atrial fibrillation (AF) that relies on accurate lesion delivery in the left atrial (LA) wall for success. Late Gadolinium Enhancement MRI (LGE MRI) at three months post-ablation has proven effective for noninvasive assessment of the location and extent of scar formation, which are important factors for predicting patient outcome and planning of redo ablation procedures. We have developed an algorithm for automatic classification in LGE MRI of scar tissue in the LA wall and have evaluated accuracy and consistency compared to manual scar classifications by expert observers. Our approach clusters voxels based on normalized intensity and was chosen through a systematic comparison of the performance of multivariate clustering on many combinations of image texture. Algorithm performance was determined by overlap with ground truth, using multiple overlap measures, and the accuracy of the estimation of the total amount of scar in the LA. Ground truth was determined using the STAPLE algorithm, which produces a probabilistic estimate of the true scar classification from multiple expert manual segmentations. Evaluation of the ground truth data set was based on both inter- and intra-observer agreement, with variation among expert classifiers indicating the difficulty of scar classification for a given a dataset. Our proposed automatic scar classification algorithm performs well for both scar localization and estimation of scar volume: for ground truth datasets considered easy, variability from the ground truth was low; for those considered difficult, variability from ground truth was on par with the variability across experts.


K. Potter, R.M. Kirby, D. Xiu, C.R. Johnson. “Interactive visualization of probability and cumulative density functions,” In International Journal of Uncertainty Quantification, Vol. 2, No. 4, pp. 397--412. 2012.
DOI: 10.1615/Int.J.UncertaintyQuantification.2012004074
PubMed ID: 23543120
PubMed Central ID: PMC3609671

ABSTRACT

The probability density function (PDF), and its corresponding cumulative density function (CDF), provide direct statistical insight into the characterization of a random process or field. Typically displayed as a histogram, one can infer probabilities of the occurrence of particular events. When examining a field over some two-dimensional domain in which at each point a PDF of the function values is available, it is challenging to assess the global (stochastic) features present within the field. In this paper, we present a visualization system that allows the user to examine two-dimensional data sets in which PDF (or CDF) information is available at any position within the domain. The tool provides a contour display showing the normed difference between the PDFs and an ansatz PDF selected by the user, and furthermore allows the user to interactively examine the PDF at any particular position. Canonical examples of the tool are provided to help guide the reader into the mapping of stochastic information to visual cues along with a description of the use of the tool for examining data generated from a uncertainty quantification exercise accomplished within the field of electrophysiology.

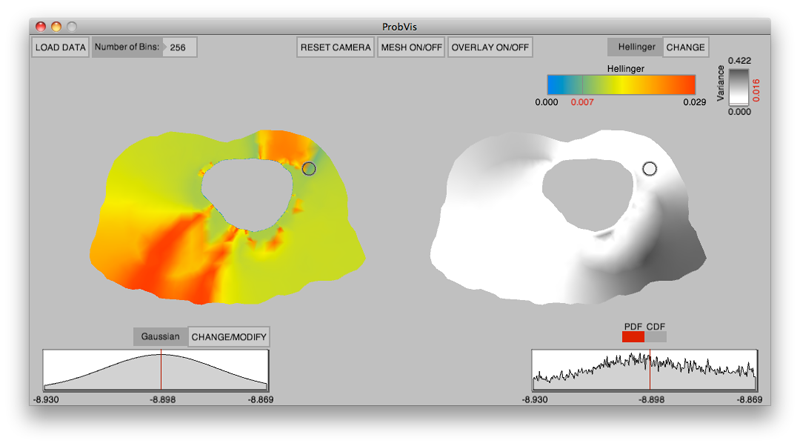
Keywords: visualization, probability density function, cumulative density function, generalized polynomial chaos, stochastic Galerkin methods, stochastic collocation methods


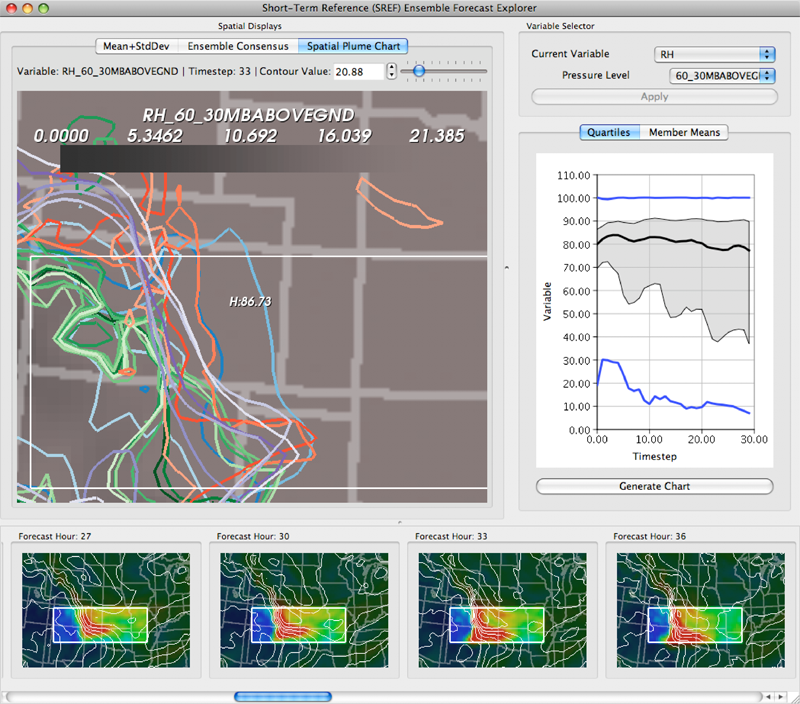
K. Potter, P. Rosen, C.R. Johnson. “From Quantification to Visualization: A Taxonomy of Uncertainty Visualization Approaches,” In Uncertainty Quantification in Scientific Computing, IFIP Advances in Information and Communication Technology Series, Vol. 377, Edited by Andrew Dienstfrey and Ronald Boisvert, Springer, pp. 226--249. 2012.
DOI: 10.1007/978-3-642-32677-6_15

ABSTRACT

Quantifying uncertainty is an increasingly important topic across many domains. The uncertainties present in data come with many diverse representations having originated from a wide variety of domains. Communicating these uncertainties is a task often left to visualization without clear connection between the quantification and visualization. In this paper, we first identify frequently occurring types of uncertainty. Second, we connect those uncertainty representations to ones commonly used in visualization. We then look at various approaches to visualizing this uncertainty by partitioning the work based on the dimensionality of the data and the dimensionality of the uncertainty. We also discuss noteworthy exceptions to our taxonomy along with future research directions for the uncertainty visualization community.

Keywords: scidac, netl, uncertainty visualization


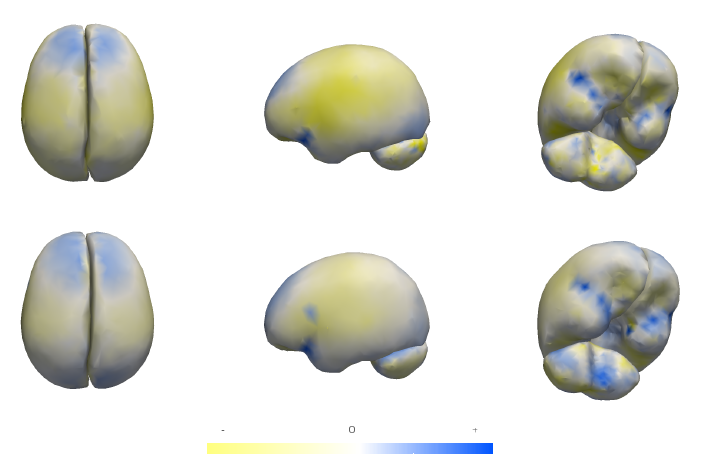
M.W. Prastawa, S.P. Awate, G. Gerig. “Building Spatiotemporal Anatomical Models using Joint 4-D Segmentation, Registration, and Subject-Speci fic Atlas Estimation,” In Proceedings of the 2012 IEEE Mathematical Methods in Biomedical Image Analysis (MMBIA) Conference, pp. 49--56. 2012.
DOI: 10.1109/MMBIA.2012.6164740
PubMed ID: 23568185
PubMed Central ID: PMC3615562

ABSTRACT

Longitudinal analysis of anatomical changes is a vital component in many personalized-medicine applications for predicting disease onset, determining growth/atrophy patterns, evaluating disease progression, and monitoring recovery. Estimating anatomical changes in longitudinal studies, especially through magnetic resonance (MR) images, is challenging because of temporal variability in shape (e.g. from growth/atrophy) and appearance (e.g. due to imaging parameters and tissue properties affecting intensity contrast, or from scanner calibration). This paper proposes a novel mathematical framework for constructing subject-specific longitudinal anatomical models. The proposed method solves a generalized problem of joint segmentation, registration, and subject-specific atlas building, which involves not just two images, but an entire longitudinal image sequence. The proposed framework describes a novel approach that integrates fundamental principles that underpin methods for image segmentation, image registration, and atlas construction. This paper presents evaluation on simulated longitudinal data and on clinical longitudinal brain MRI data. The results demonstrate that the proposed framework effectively integrates information from 4-D spatiotemporal data to generate spatiotemporal models that allow analysis of anatomical changes over time.

Keywords: namic, adni, autism


R. Ranjan, E.G. Kholmovski, J. Blauer, S. Vijayakumar, N.A. Volland, M.E. Salama, D.L. Parker, R.S. MacLeod, N.F. Marrouche. “Identification and Acute Targeting of Gaps in Atrial Ablation Lesion Sets Using a Real-Time Magnetic Resonance Imaging System,” In Circulation: Arrhythmia and Electrophysiology, Vol. 5, pp. 1130--1135. 2012.
DOI: 10.1161/CIRCEP.112.973164
PubMed ID: 23071143
PubMed Central ID: PMC3691079

ABSTRACT

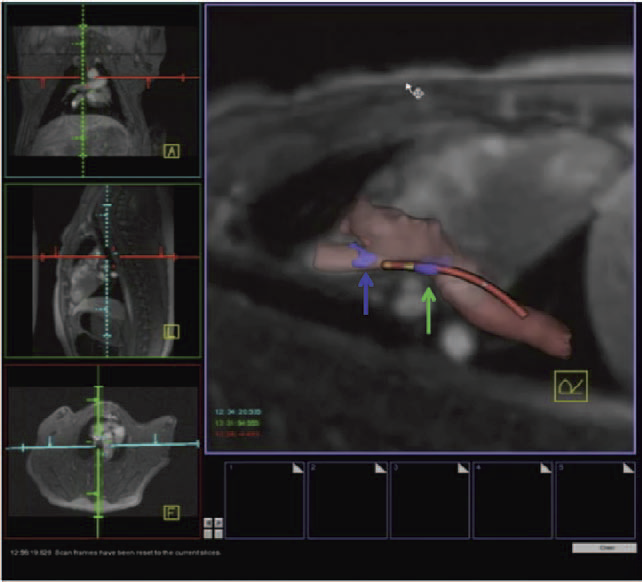
Background - Radiofrequency ablation is routinely used to treat cardiac arrhythmias, but gaps remain in ablation lesion sets because there is no direct visualization of ablation-related changes. In this study, we acutely identify and target gaps using a real-time magnetic resonance imaging (RT-MRI) system, leading to a complete and transmural ablation in the atrium.

Methods and Results - A swine model was used for these studies (n=12). Ablation lesions with a gap were created in the atrium using fluoroscopy and an electroanatomic system in the first group (n=5). The animal was then moved to a 3-tesla MRI system where high-resolution late gadolinium enhancement MRI was used to identify the gap. Using an RT-MRI catheter navigation and visualization system, the gap area was ablated in the MR scanner. In a second group (n=7), ablation lesions with varying gaps in between were created under RT-MRI guidance, and gap lengths determined using late gadolinium enhancement MR images were correlated with gap length measured from gross pathology. Gaps up to 1.0 mm were identified using gross pathology, and gaps up to 1.4 mm were identified using late gadolinium enhancement MRI. Using an RT-MRI system with active catheter navigation gaps can be targeted acutely, leading to lesion sets with no gaps. The correlation coefficient (R2) between the gap length was identified using MRI, and the gross pathology was 0.95.

Conclusions - RT-MRI system can be used to identify and acutely target gaps in atrial ablation lesion sets. Acute targeting of gaps in ablation lesion sets can potentially lead to significant improvement in clinical outcomes.