SCI Publications
2014


A.R. Sanderson.
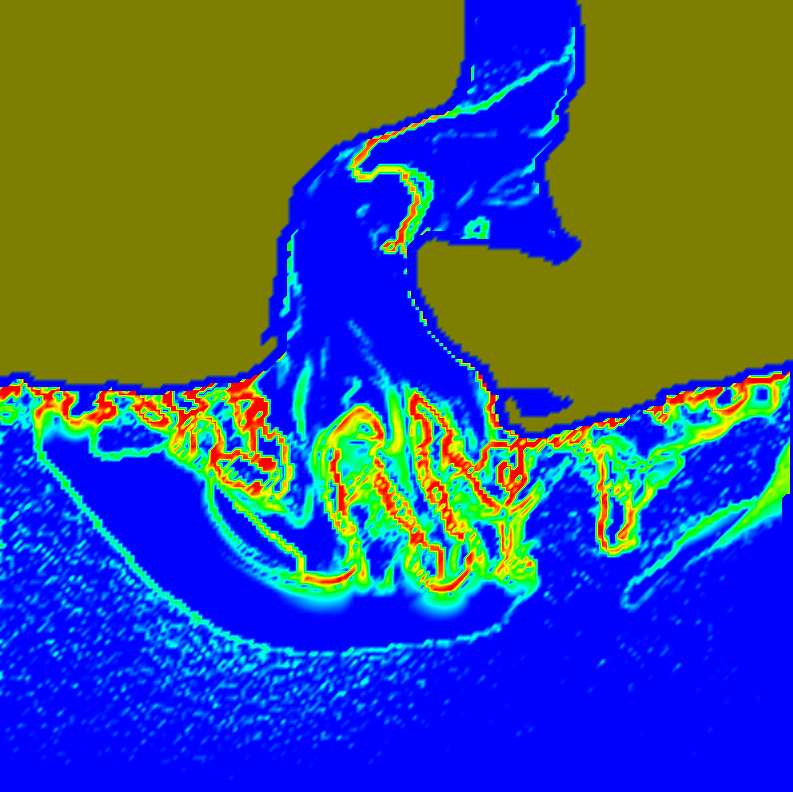
“An Alternative Formulation of Lyapunov Exponents for Computing Lagrangian Coherent Structures,” In Proceedings of the 2014 IEEE Pacific Visualization Symposium (PacificVis), Yokahama Japan, 2014.
Lagrangian coherent structures are time-evolving surfaces that highlight areas in flow fields where neighboring advected particles diverge or converge. The detection and understanding of such structures is an important part of many applications such as in oceanography where there is a need to predict the dispersion of oil and other materials in the ocean. One of the most widely used tools for revealing Lagrangian coherent structures has been to calculate the finite-time Lyapunov exponents, whose maximal values appear as ridgelines to reveal Lagrangian coherent structures. In this paper we explore an alternative formulation of Lyapunov exponents for computing Lagrangian coherent structures.
2012


A.R. Sanderson, B. Whitlock, O. Reubel, H. Childs, G.H. Weber, Prabhat, K. Wu.
“A System for Query Based Analysis and Visualization,” In Proceedings of the Third International Eurovis Workshop on Visual Analytics EuroVA 2012, pp. 25--29. June, 2012.
Today scientists are producing large volumes of data that they wish to explore and visualize. In this paper we describe a system that combines range-based queries with fast lookup to allow a scientist to quickly and efficiently ask \"what if?\" questions. Unique to our system is the ability to perform "cumulative queries" that work on both an intra- and inter-time step basis. The results of such queries are visualized as frequency histograms and are the input for secondary queries, the results of which are then visualized.

A.R. Sanderson, G. Chen, X. Tricoche, E. Cohen.
“Understanding Quasi-Periodic Fieldlines and Their Topology in Toroidal Magnetic Fields,” In Topological Methods in Data Analysis and Visualization II, Edited by R. Peikert and H. Carr and H. Hauser and R. Fuchs, Springer, pp. 125--140. 2012.
DOI: 10.1007/478-3-642-23175-9
2010


A.R. Sanderson, G. Chen, X. Tricoche, D. Pugmire, S. Kruger, J. Breslau.
“Analysis of Recurrent Patterns in Toroidal Magnetic Fields,” In IEEE Transactions on Visualization and Computer Graphics, Vol. 16, No. 6, IEEE, pp. 1431-1440. Nov, 2010.
DOI: 10.1109/tvcg.2010.133
2009


E.W. Bethel, C.R. Johnson, S. Ahern, J. Bell, P.-T. Bremer, H. Childs, E. Cormier-Michel, M. Day, E. Deines, P.T. Fogal, C. Garth, C.G.R. Geddes, H. Hagen, B. Hamann, C.D. Hansen, J. Jacobsen, K.I. Joy, J. Krüger, J. Meredith, P. Messmer, G. Ostrouchov, V. Pascucci, K. Potter, Prabhat, D. Pugmire, O. Rubel, A.R. Sanderson, C.T. Silva, D. Ushizima, G.H. Weber, B. Whitlock, K. Wu.
“Occam's Razor and Petascale Visual Data Analysis,” In Journal of Physics: Conference Series, Journal of Physics: Conference Series, Vol. 180, No. 012084, pp. (published online). 2009.
DOI: 10.1088/1742-6596/180/1/012084
One of the central challenges facing visualization research is how to effectively enable knowledge discovery. An effective approach will likely combine application architectures that are capable of running on today's largest platforms to address the challenges posed by large data with visual data analysis techniques that help find, represent, and effectively convey scientifically interesting features and phenomena.


A.R. Sanderson, M.D. Meyer, R.M. Kirby, C.R. Johnson.
“A Framework for Exploring Numerical Solutions of Advection Reaction Diffusion Equations using a GPU Based Approach,” In Journal of Computing and Visualization in Science, Vol. 12, pp. 155--170. 2009.
DOI: 10.1007/s00791-008-0086-0


D. Sato, Y. Xie, J.N. Weiss, Z. Qu, A. Garfinkel, A.R. Sanderson.
“Acceleration of Cardiac Tissue Simulation with Graphic Processing Units,” In Medical and Biological Engineering and Computing, Note: Published online Aug 5, 2009, 2009.
DOI: 10.1007/s11517-0
2007


E.W. Bethel, C.R. Johnson, K. Joy, S. Ahern, V. Pascucci, H. Childs, J. Cohen, M. Duchaineau, B. Hamann, C.D. Hansen, D. Laney, P. Lindstrom, J. Meredith, G. Ostrouchov, S.G. Parker, C.T. Silva, A.R. Sanderson, X. Tricoche.
“SciDAC Visualization and Analytics Center for Enabling Technology,” In Journal of Physics, Conference Series, Vol. 78, No. 012032, pp. (published online). 2007.

E.W. Bethel, C.R. Johnson, C. Aragon, Prabhat, O. Rübel, G. Weber, V. Pascucci, H. Childs, P.-T. Bremer, B. Whitlock, S. Ahern, J. Meredith, G. Ostrouchov, K. Joy, B. Hamann, C. Garth, M. Cole, C.D. Hansen, S.G. Parker, A.R. Sanderson, C.T. Silva, X. Tricoche.
“DOE's SciDAC Visualization and Analytics Center for Enabling Technologies - Strategy for Petascale Visual Data Analysis Success,” In CTWatch Quarterly, Vol. 3, No. 4, 2007.


C. Jones, K.-L. Ma, A.R. Sanderson, L. Myers.
“Visual Interrogation of Gyrokinetic Particle Simulations,” In Journal of Physics, Conference Series, Vol. 78, pp. 012033 (6pp). 2007.
2006


W. Bethel, C.R. Johnson, C.D. Hansen, S.G. Parker, A.R. Sanderson, C.T. Silva, X. Tricoche, V. Pascucci, H. Childs, J. Cohen, M. Duchaineau, D. Laney, P. Lindstrom, S. Ahern, J. Meredith, G. Ostrouchov, K. Joy, B. Hamann.
“VACET: Proposed SciDAC2 Visualization and Analytics Center for Enabling Technologies,” In J. Phys.: Conf. Ser., Vol. 46, pp. 561--569. 2006.


A.R. Sanderson, R.M. Kirby, C.R. Johnson, L. Yang.
“Advanced Reaction-Diffusion Models for Texture Synthesis,” In Journal of Graphics Tools, Vol. 11, No. 3, pp. 47--71. 2006.

A.R. Sanderson, X. Tricoche, C. Garth, S. Kruger, C. Sovinec, E. Held, J. Breslau.
“Detection of Magnetic Nulls in Toroidal Geometry,” In Proceedings of the 48th Annual Meeting of the Division of Plasma Physics, 2006.


A.R. Sanderson, X. Tricoche, C. Garth, S. Kruger, C. Sovinec, E. Held, J. Breslau.
“Visualizing Patterns in the Poincare Plot of a Magnetic Field,” In IEEE Visualization Conference 2006 Compendium, 2006.
2004


A.R. Sanderson, C.R. Johnson, R.M. Kirby.
“Display of Vector Fields Using a Reaction Diffusion Model,” In Proceeding of IEEE Visualization 2004, pp. 115--122. 2004.
2003


C.R. Johnson, A.R. Sanderson.
“A Next Step: Visualizing Errors and Uncertainty,” In IEEE Computer Graphics and Applications, Vol. 23, No. 5, pp. 6--10. September/October, 2003.


A.R. Sanderson, C.R. Johnson.
“Display of Vector Fields Using a Reaction-Diffusion Model,” SCI Institute Technical Report, No. UUSCI-2003-002, University of Utah, June, 2003.
2002


J. Simpson, A.R. Sanderson, E. Luke, K. Balling, R. Coffey.
“Collaborative Remote Visualization,” In Proceedings of the IEEE/ACM SC2002 Conference, Baltimore, Maryland, November, 2002.


J. Simpson, A.R. Sanderson, E. Luke, K. Balling, R. Coffey.
“Collaborative Remote Visualization,” In Presented before the Utah State Legislature, 2002.


