


SCI Publications
2024


T. M. Athawale, B. Triana, T. Kotha, D. Pugmire, P. Rosen.
“A Comparative Study of the Perceptual Sensitivity of Topological Visualizations to Feature Variations,” In IEEE Transactions on Visualization and Computer Graphics, Vol. 30, No. 1, pp. 1074-1084. Jan, 2024.
DOI: 10.1109/TVCG.2023.3326592
Color maps are a commonly used visualization technique in which data are mapped to optical properties, e.g., color or opacity. Color maps, however, do not explicitly convey structures (e.g., positions and scale of features) within data. Topology-based visualizations reveal and explicitly communicate structures underlying data. Although we have a good understanding of what types of features are captured by topological visualizations, our understanding of people’s perception of those features is not. This paper evaluates the sensitivity of topology-based isocontour, Reeb graph, and persistence diagram visualizations compared to a reference color map visualization for synthetically generated scalar fields on 2-manifold triangular meshes embedded in 3D. In particular, we built and ran a human-subject study that evaluated the perception of data features characterized by Gaussian signals and measured how effectively each visualization technique portrays variations of data features arising from the position and amplitude variation of a mixture of Gaussians. For positional feature variations, the results showed that only the Reeb graph visualization had high sensitivity. For amplitude feature variations, persistence diagrams and color maps demonstrated the highest sensitivity, whereas isocontours showed only weak sensitivity. These results take an important step toward understanding which topology-based tools are best for various data and task scenarios and their effectiveness in conveying topological variations as compared to conventional color mapping.
2021
P. Rosen, A. Seth, E. Mills, A. Ginsburg, J. Kamenetzky, J. Kern, C.R. Johnson, B. Wang.
“Using Contour Trees in the Analysis and Visualization of Radio Astronomy Data Cubes,” In Topological Methods in Data Analysis and Visualization VI, Springer-Verlag, pp. 87--108. 2021.
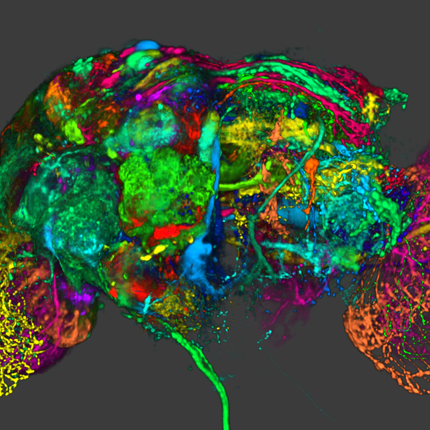
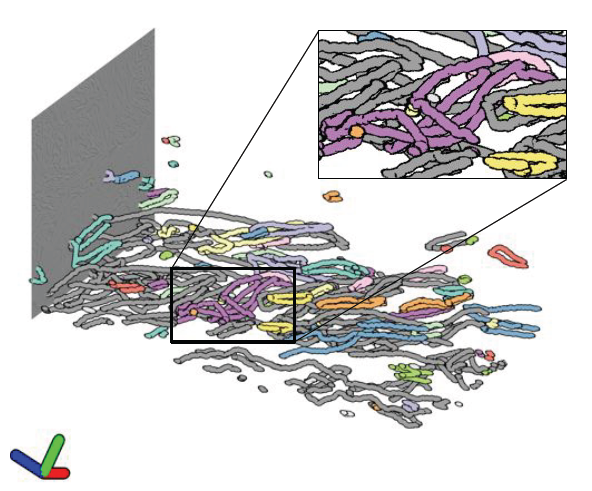
The current generation of radio and millimeter telescopes, particularly the Atacama Large Millimeter Array (ALMA), offers enormous advances in observing capabilities. While these advances represent an unprecedented opportunity to facilitate scientific understanding, the increased complexity in the spatial and spectral structure of these ALMA data cubes lead to challenges in their interpretation. In this paper, we perform a feasibility study for applying topological data analysis and visualization techniques never before tested by the ALMA community. Using techniques based on contour trees, we seek to improve upon existing analysis and visualization workflows of ALMA data cubes, in terms of accuracy and speed in feature extraction. We review our development process in building effective analysis and visualization capabilities for the astrophysicists. We also summarize effective design practices by identifying domain-specific needs of simplicity, integrability, and reproducibility, in order to best target and service the large astrophysics community.
2018
M. Hajij, B. Wang, C. Scheidegger, P. Rosen.
“Visual Detection of Structural Changes in Time-Varying Graphs Using Persistent Homology,” In 2018 IEEE Pacific Visualization Symposium (PacificVis), IEEE, April, 2018.
DOI: 10.1109/pacificvis.2018.00024
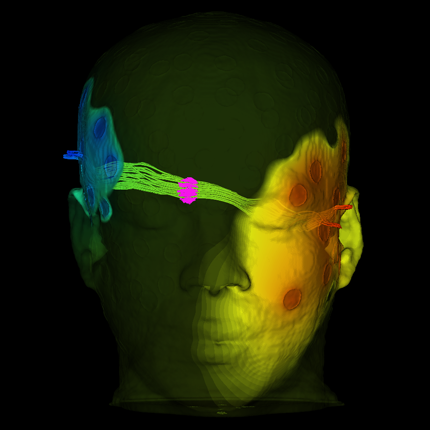
Topological data analysis is an emerging area in exploratory data analysis and data mining. Its main tool, persistent homology, has become a popular technique to study the structure of complex, high-dimensional data. In this paper, we propose a novel method using persistent homology to quantify structural changes in time-varying graphs. Specifically, we transform each instance of the time-varying graph into a metric space, extract topological features using persistent homology, and compare those features over time. We provide a visualization that assists in time-varying graph exploration and helps to identify patterns of behavior within the data. To validate our approach, we conduct several case studies on real-world datasets and show how our method can find cyclic patterns, deviations from those patterns, and one-time events in time-varying graphs. We also examine whether a persistence-based similarity measure satisfies a set of well-established, desirable properties for graph metrics.
M. Hajij, B. Wang, P. Rosen.
“MOG: Mapper on Graphs for Relationship Preserving Clustering,” In CoRR, 2018.
The interconnected nature of graphs often results in difficult to interpret clutter. Typically techniques focus on either decluttering by clustering nodes with similar properties or grouping edges with similar relationship. We propose using mapper, a powerful topological data analysis tool, to summarize the structure of a graph in a way that both clusters data with similar properties and preserves relationships. Typically, mapper operates on a given data by utilizing a scalar function defined on every point in the data and a cover for scalar function codomain. The output of mapper is a graph that summarize the shape of the space. In this paper, we outline how to use this mapper construction on an input graphs, outline three filter functions that capture important structures of the input graph, and provide an interface for interactively modifying the cover. To validate our approach, we conduct several case studies on synthetic and real world data sets and demonstrate how our method can give meaningful summaries for graphs with various complexities
2017
A. Suh, M. Hajij, B. Wang, C. Scheidegger, P. Rosen.
“Driving Interactive Graph Exploration Using 0-Dimensional Persistent Homology Features,” In CoRR, 2017.
Graphs are commonly used to encode relationships among entities, yet, their abstractness makes them incredibly difficult to analyze. Node-link diagrams are a popular method for drawing graphs. Classical techniques for the node-link diagrams include various layout methods that rely on derived information to position points, which often lack interactive exploration functionalities; and force-directed layouts, which ignore global structures of the graph. This paper addresses the graph drawing challenge by leveraging topological features of a graph as derived information for interactive graph drawing. We first discuss extracting topological features from a graph using persistent homology. We then introduce an interactive persistence barcodes to study the substructures of a force-directed graph layout; in particular, we add contracting and repulsing forces guided by the 0-dimensional persistent homology features. Finally, we demonstrate the utility of our approach across three datasets.
2016
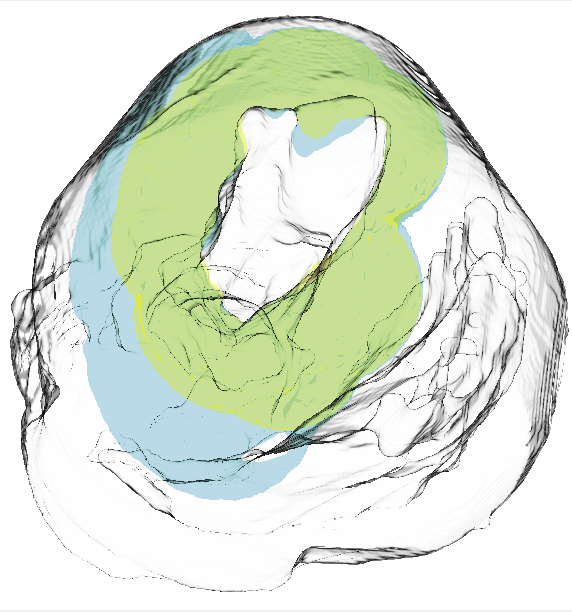
P. Rosen, B. Burton, K. Potter, C.R. Johnson.
“muView: A Visual Analysis System for Exploring Uncertainty in Myocardial Ischemia Simulations,” In Visualization in Medicine and Life Sciences III, Springer Nature, pp. 49--69. 2016.
DOI: 10.1007/978-3-319-24523-2_3

2015
P. Skraba, Bei Wang, G. Chen, P. Rosen.
“Robustness-Based Simplification of 2D Steady and Unsteady Vector Fields,” In IEEE Transactions on Visualization and Computer Graphics (to appear), 2015.
2014
Y. Joon Ahn, C. Hoffmann, P. Rosen.
“Geometric constraints on quadratic Bézier curves using minimal length and energy,” In Journal of Computational and Applied Mathematics, Vol. 255, pp. 887--897. 2014.
This paper derives expressions for the arc length and the bending energy of quadratic Bézier curves. The formulas are in terms of the control point coordinates. For fixed start and end points of the Bézier curve, the locus of the middle control point is analyzed for curves of fixed arc length or bending energy. In the case of arc length this locus is convex. For bending energy it is not. Given a line or a circle and fixed end points, the locus of the middle control point is determined for those curves that are tangent to a given line or circle. For line tangency, this locus is a parallel line. In the case of the circle, the locus can be classified into one of six major types. In some of these cases, the locus contains circular arcs. These results are then used to implement fast algorithms that construct quadratic Bézier curves tangent to a given line or circle, with given end points, that minimize bending energy or arc length.
P. Skraba, Bei Wang, G. Chen, P. Rosen.
“2D Vector Field Simplification Based on Robustness,” In Proceedings of the 2014 IEEE Pacific Visualization Symposium, PacificVis, Note: Awarded Best Paper!, 2014.

Keywords: vector field, topology-based techniques, flow visualization
2013
B. Burton, B. Erem, K. Potter, P. Rosen, C.R. Johnson, D. Brooks, R.S. Macleod.
“Uncertainty Visualization in Forward and Inverse Cardiac Models,” In Computing in Cardiology CinC, pp. 57--60. 2013.
ISSN: 2325-8861
P. Rosen, B. Burton, K. Potter, C.R. Johnson.
“Visualization for understanding uncertainty in the simulation of myocardial ischemia,” In Proceedings of the 2013 Workshop on Visualization in Medicine and Life Sciences, 2013.
P. Rosen.
“A Visual Approach to Investigating Shared and Global Memory Behavior of CUDA Kernels,” In Computer Graphics Forum, Vol. 32, No. 3, Wiley-Blackwell, pp. 161--170. June, 2013.
DOI: 10.1111/cgf.12103
We present an approach to investigate the memory behavior of a parallel kernel executing on thousands of threads simultaneously within the CUDA architecture. Our top-down approach allows for quickly identifying any significant differences between the execution of the many blocks and warps. As interesting warps are identified, we allow further investigation of memory behavior by visualizing the shared memory bank conflicts and global memory coalescence, first with an overview of a single warp with many operations and, subsequently, with a detailed view of a single warp and a single operation. We demonstrate the strength of our approach in the context of a parallel matrix transpose kernel and a parallel 1D Haar Wavelet transform kernel.
P. Skraba, Bei Wang, G. Chen, P. Rosen.
“2D Vector Field Simplification Based on Robustness,” SCI Technical Report, No. UUSCI-2013-004, SCI Institute, University of Utah, 2013.
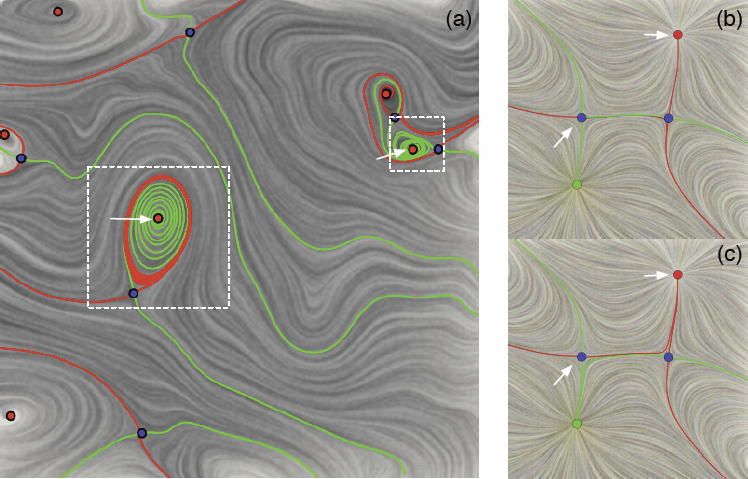
Bei Wang, P. Rosen, P. Skraba, H. Bhatia, V. Pascucci.
“Visualizing Robustness of Critical Points for 2D Time-Varying Vector Fields,” In Computer Graphics Forum, Vol. 32, No. 3, Wiley-Blackwell, pp. 221--230. jun, 2013.
DOI: 10.1111/cgf.12109
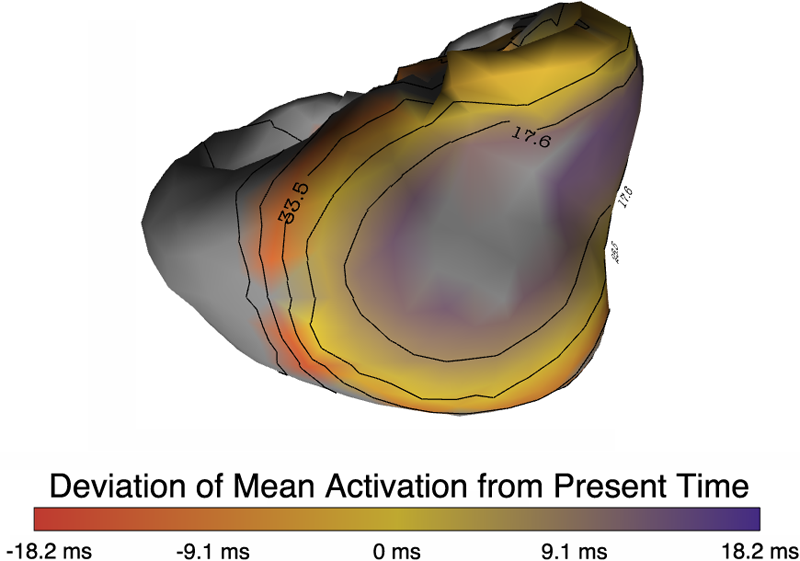
Analyzing critical points and their temporal evolutions plays a crucial role in understanding the behavior of vector fields. A key challenge is to quantify the stability of critical points: more stable points may represent more important phenomena or vice versa. The topological notion of robustness is a tool which allows us to quantify rigorously the stability of each critical point. Intuitively, the robustness of a critical point is the minimum amount of perturbation necessary to cancel it within a local neighborhood, measured under an appropriate metric. In this paper, we introduce a new analysis and visualization framework which enables interactive exploration of robustness of critical points for both stationary and time-varying 2D vector fields. This framework allows the end-users, for the first time, to investigate how the stability of a critical point evolves over time. We show that this depends heavily on the global properties of the vector field and that structural changes can correspond to interesting behavior. We demonstrate the practicality of our theories and techniques on several datasets involving combustion and oceanic eddy simulations and obtain some key insights regarding their stable and unstable features.
W. Widanagamaachchi, P. Rosen, V. Pascucci.
“A Flexible Framework for Fusing Image Collections into Panoramas,” In Proceedings of the 2013 SIBGRAPI Conference on Graphics, Patterns, and Images, Note: Awarded Best Paper., pp. 195-202. 2013.
DOI: 10.1109/SIBGRAPI.2013.35

2012
Y.-J. Ahn, C. Hoffmann, P. Rosen.
“A Note on Circle Packing,” In Journal of Zhejiang University SCIENCE C, Vol. 13, No. 8, pp. 559--564. 2012.
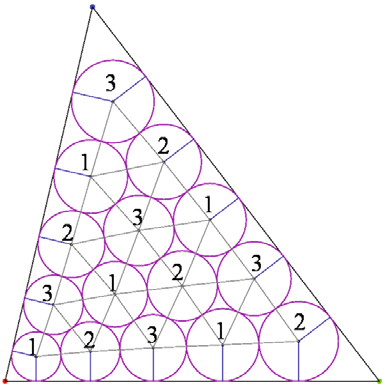
Keywords: Circle packing, Algorithm performance, Parallel computation, Graphics processing unit (GPU)
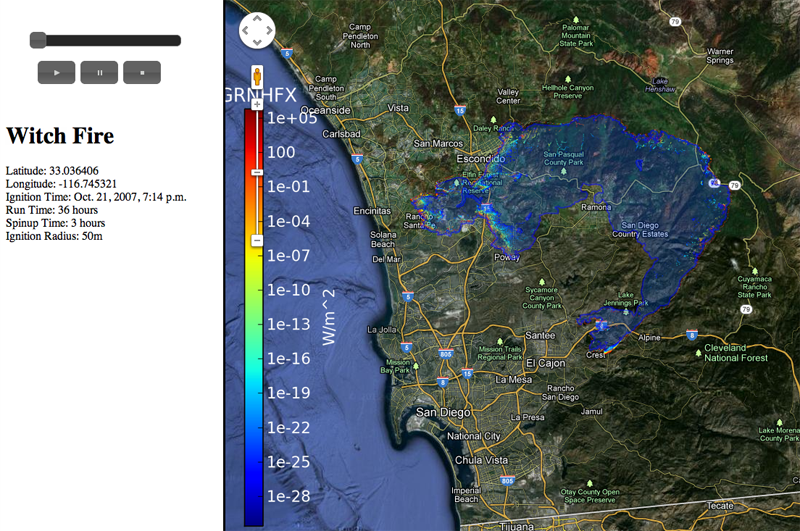
J. Beezley, M. Martin, P. Rosen, J. Mandel, A. Kochanski.
“Data management and analysis with WRF and SFIRE,” In Proceedings of the IEEE International Geoscience and Remote Sensing Symposium, Note: UCD CCM Report 312, 2012.
C.-S. Chiang, C. Hoffmann, P. Rosen.
“A Generalized Malfatti Problem,” In Computational Geometry: Theory and Applications, Vol. 45, No. 8, pp. 425--435. 2012.
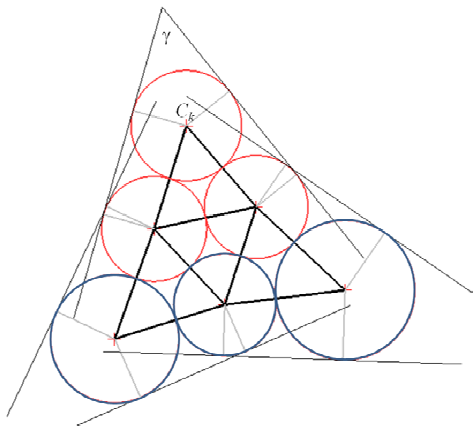
Keywords: Malfatti's problem, circle packing, geometric constraint solving, GPU programming
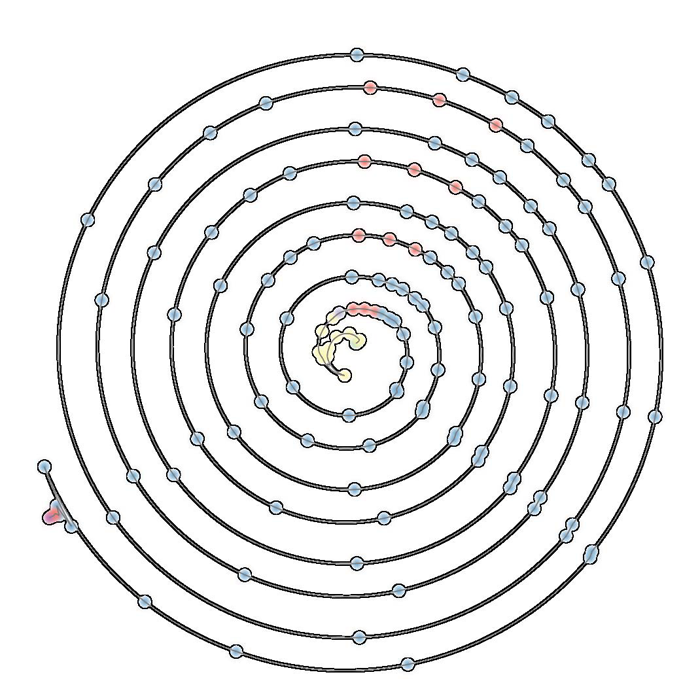
A.N.M. Imroz Choudhury, Bei Wang, P. Rosen, V. Pascucci.
“Topological Analysis and Visualization of Cyclical Behavior in Memory Reference Traces,” In Proceedings of the IEEE Pacific Visualization Symposium (PacificVis 2012), pp. 9--16. 2012.
DOI: 10.1109/PacificVis.2012.6183557
Keywords: scidac
K. Potter, P. Rosen, C.R. Johnson.
“From Quantification to Visualization: A Taxonomy of Uncertainty Visualization Approaches,” In Uncertainty Quantification in Scientific Computing, IFIP Advances in Information and Communication Technology Series, Vol. 377, Edited by Andrew Dienstfrey and Ronald Boisvert, Springer, pp. 226--249. 2012.
DOI: 10.1007/978-3-642-32677-6_15
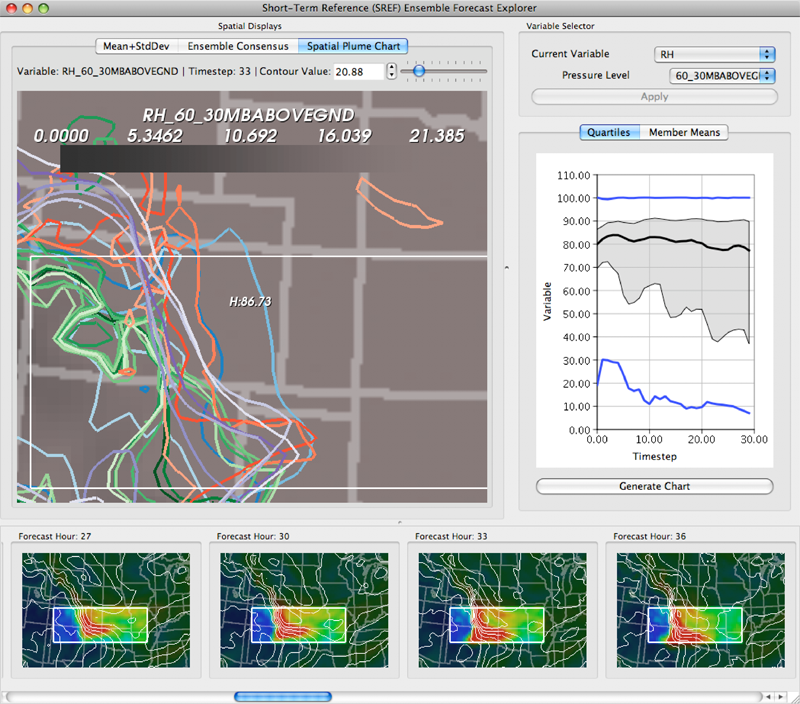
Keywords: scidac, netl, uncertainty visualization