J.D. Brederson and M. Ikits
What is Immersive Visualization?
The goal of visualization is to aid in the understanding of complex scientific data, typically using techniques from the fields of computer graphics and animation. To gain additional insight, immersive visualization places the user directly within the data space through virtual reality technology. The resulting immersive experience allows exploration from a first-person perspective, in contrast to the third-person interaction typical of desktop environments.
The feeling of actually "being there" in a virtual environment, also known as
presence, is created by fooling one or more of the user's senses with computer generated cues. In a typical system, stereo images provide a sense of visual depth and natural interaction is achieved with tracking sensors and 3D input devices. More advanced systems may also include force-feedback, spatialized audio, and/or voice recognition capabilities to increase the sense of presence.
Imagine directly navigating through a scientific dataset, much like one experiences the real world. How would it feel to investigate the interesting features of the data with your sense of touch? Would this capability be useful or not? These are the types of questions Virtual Reality (VR) researchers at the SCI institute currently seek to answer.
Immersive VR at the SCI Institute
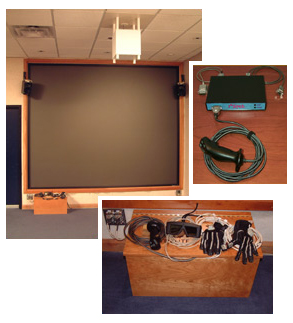
Over the past two years the VR Lab has developed fundamental infrastructure for immersive visualization research. Our facilities include a large projected wall display (Figure 1), a custom integrated workbench (Figure 2), and a custom interaction device.
 |
| Figure 1: The SGI-Utah Visual Supercomputing Center (VSC) has a large, projected wall display for VR applications. Click on the images for more information. |
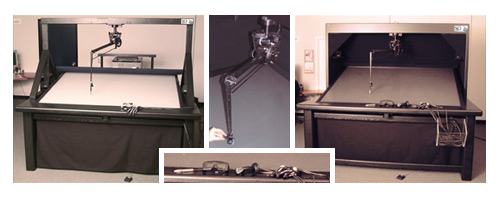 |
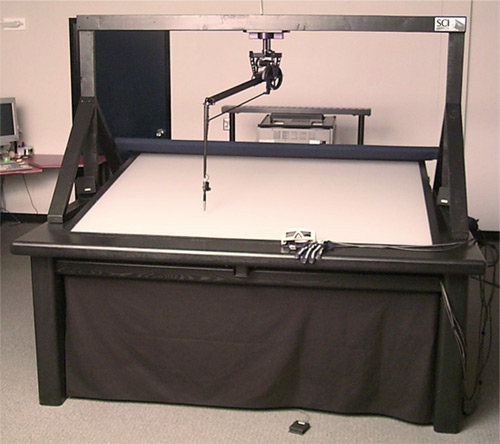
| Figure 2: The Visual Haptic Workbench, an integrated setup for synergistic data display. Click on the images for more information. |
Our current efforts are aimed at completing development of a flexible software framework for immersive application prototyping. The ability to run an application in any supported environment without modifications is a crucial requirement for such a framework. The Unified Virtual Environment (UVE) achieves this flexibility by providing an abstraction of the underlying device configuration. Thus, the developer can focus on the application content rather than the specific hardware details of a particular setup. One novel element of this library is that force-feedback devices, which provide the fundamental sense of touch, are integrated in the same manner as other devices. Presently, UVE supports our VR facilities at the SCI Institute and will support most VR setups in the near future.
To make scientific data exploration and investigation more effective, a suite of 3D widgets and interaction techniques have been designed and incorporated into the Unified Virtual Widget (UVW) library. UVW provides a unified immersive interface, sharing a similar design philosophy to UVE. Using UVW, it is possible to extend common interaction paradigms without replacing the traditional methods of the desktop user interface.
Techniques to facilitate the combined use of graphical and force-feedback data rendering comprise the Synergistic Display (SD) library. These include traditional visualization methods such as icons, stream constructions, and volume rendering, as well as novel force-feedback algorithms. Together these methods permit the user to feel and see the data simultaneously.
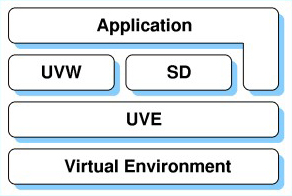 |
| Figure 3: Our new software development framework for immersive applications. |
The combination of our libraries forms an integrated software environment for developing immersive visualization applications. Figure 3 shows the structure of our framework and the relationships among the libraries and the application.
Examples
The following images demonstrate current research directions and some initial results. Shown here are examples of immersive flow visualization, where the underlying data represents the motion of fluid or gas under specific physical conditions. The first dataset shown is a synthetic tornado, and the second is a single timestep from a shockwave physics simulation.
| Figure 4: A user interacts with the tornado dataset using the Visual Haptic Workbench (left). Screenshot of the same application running on a Linux PC (right). Dataset provided courtesy of R. Crawfis, The Ohio State University, and N. Max, Visualization Laboratory, Lawrence Livermore National Laboratory. Click on the images for additional information and more examples of the tornado dataset. |
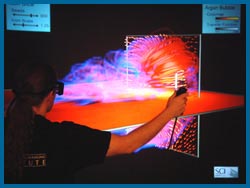
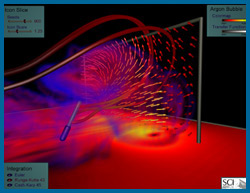
| Figure 5: A user interacts with the Argon bubble dataset using the VSC Wall Display (left). Screenshot of the same application running on a Linux PC (right). Dataset provided courtesy of J. Bell and V. Beckner, Center for Computational Sciences and Engineering, Lawrence Berkeley National Laboratory. Click on the images for additional information and more examples of the Argon bubble dataset. |
Future Directions
The VR Lab recently welcomed two new graduate students,
Rose Mills, who has experience in biomechanics and hardware interfaces, and
Betty Mohler, who has done work in haptic surgical simulation. Their combined research interests include haptics, visualization, surgical planning and simulation, and virtual medicine. These new directions will expand the exciting immersive visualization research currently underway at the SCI Institute.
The Visual Haptic Workbench Prototype
 Our initial prototype of a system designed to support synergistic data display. Our initial prototype of a system designed to support synergistic data display.
|
The Visual Haptic Workbench Today
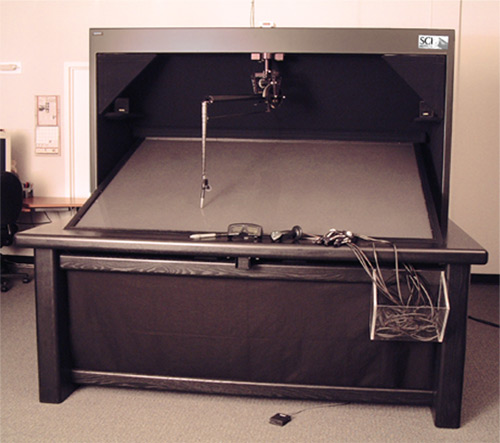 The completed production system. Recent improvements include installation of a primary surface mirror, a new diffusion surface, and a stiff, all-wood mounting frame for the PHANToM. The completed production system. Recent improvements include installation of a primary surface mirror, a new diffusion surface, and a stiff, all-wood mounting frame for the PHANToM.
|
The I3Stick
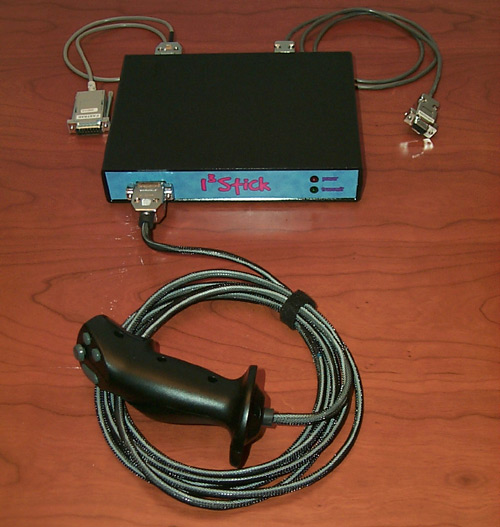 Our custom hand-held input device, the I3Stick, with its electronics unit. Our custom hand-held input device, the I3Stick, with its electronics unit.
|
The Visual Haptic Workbench Haptic Interface
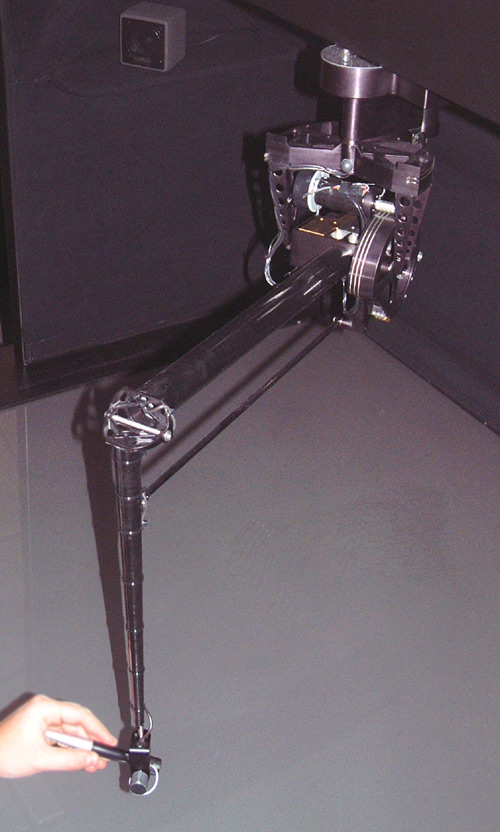 A close up of our haptic interface, a SensAble Technologies PHANToM 3.0 force-feedback device, mounted above the display surface in an inverted configuration. The user grips the stylus and receives force cues from the device, thus utilizing the additional sense of touch. A close up of our haptic interface, a SensAble Technologies PHANToM 3.0 force-feedback device, mounted above the display surface in an inverted configuration. The user grips the stylus and receives force cues from the device, thus utilizing the additional sense of touch.
|
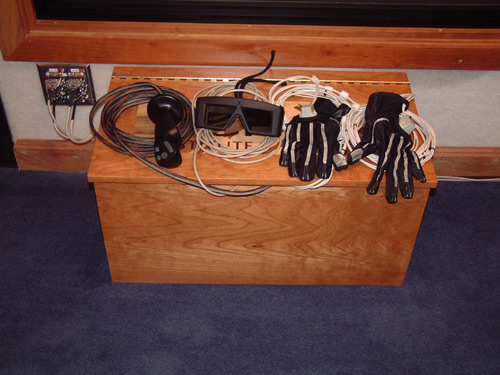
Immersive Tools for the Visual Haptic Workbench
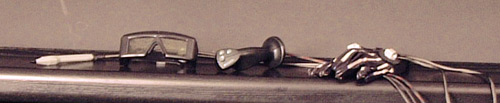 The user interface components of the Visual Haptic Workbench are shown above (from left to right): Polhemus Fastrak stylus, Stereographics CrystalEyes3 LCD shutter glasses, our custom I3Stick, and a pair of Fakespace Pinch gloves. These devices are tracked by Polhemus Fastrak receivers. The user interface components of the Visual Haptic Workbench are shown above (from left to right): Polhemus Fastrak stylus, Stereographics CrystalEyes3 LCD shutter glasses, our custom I3Stick, and a pair of Fakespace Pinch gloves. These devices are tracked by Polhemus Fastrak receivers.
|
The SGI-Utah VSC Wall Display
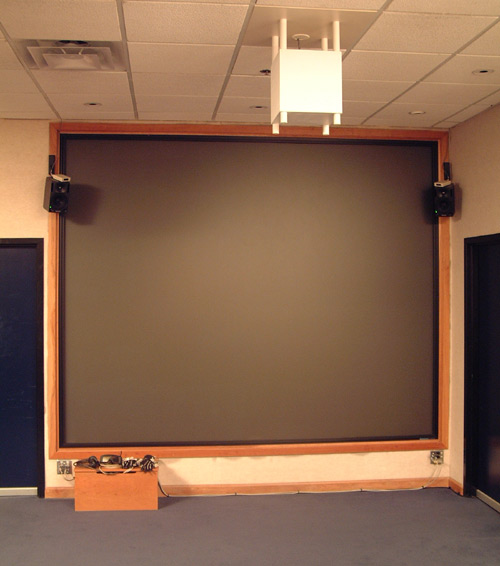 The projected wall display for VR applications in the VSC. The white cube at the top of the image is an Ascension Flock of Birds Extended Range Transmitter. The projected wall display for VR applications in the VSC. The white cube at the top of the image is an Ascension Flock of Birds Extended Range Transmitter.
|
The VSC VR Toolbox
The user interface components of the VSC Wall setup are shown above (from left to right): our custom I3Stick, Stereographics CrystalEyes3 LCD shutter glasses, and a pair of Fakespace Pinch gloves. These devices are tracked by Ascension Flock of Birds receivers. |
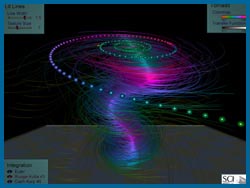
Synthetic Tornado Visualization
The dataset visualized here is a simulation of the wind flow typical of a tornado funnel. The shape of the tornado funnel is visualized using illuminated streamlines, and a string of streamballs are interactively seeded from a local probe. The Visual Haptic Workbench uses this local probe to provide force-feedback cues so that the user can feel the data locally.
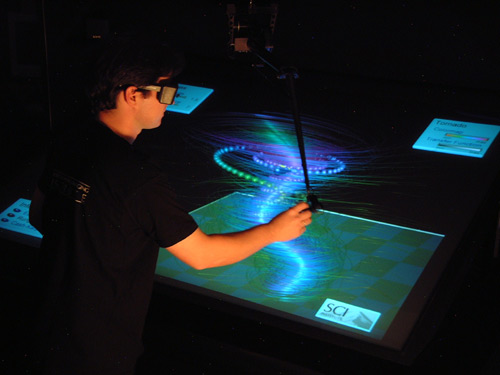
Milan probes the edge of the funnel below the rim on the Visual Haptic Workbench. |
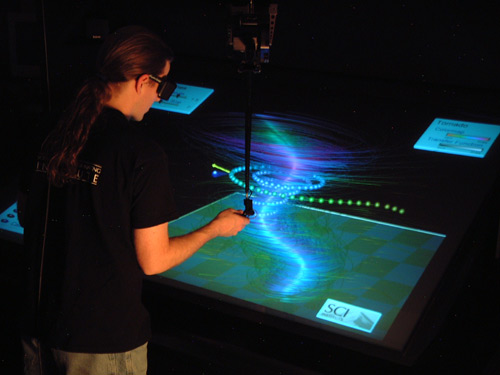
Dean investigates the flow outside of the funnel on the Visual Haptic Workbench. |
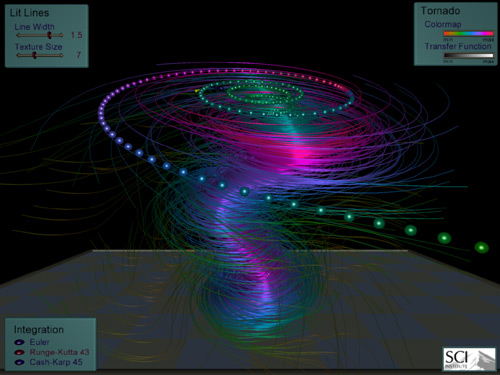
Desktop visualization of the tornado dataset. The illuminated streamlines are emphasized to show the shape of the funnel. |
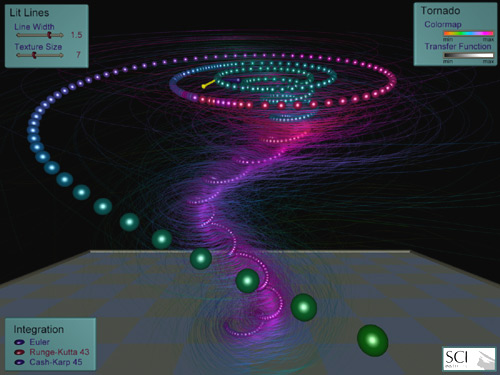
A similar visualization to the above showing the top of the funnel and demonstrating how flow exits the top of the funnel. |
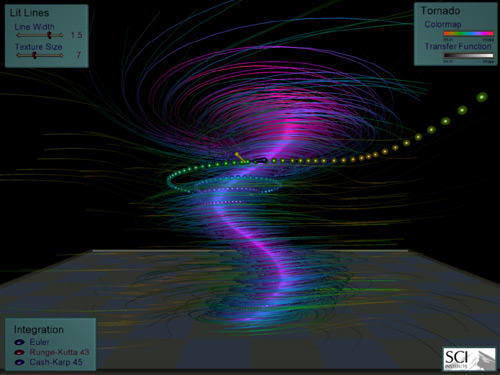
This image emphasizes the internal path of the streamballs. The colormap in the upper-right shows how the streamballs are colored by field magnitude. Streamballs within the tornado core (purple and pink) exit the funnel (aqua) and then reach a maximum field magnitude (magenta) before moving away from the funnel (green). |
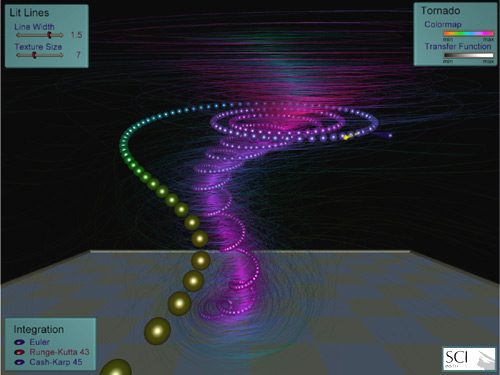
Here the streamballs from the edge of the funnel exit below the rim and demonstrate a gentler exit (lower field magnitude) on their way out of the core. |
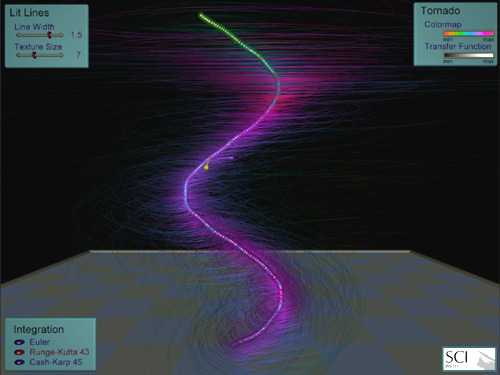
The tornado core is clearly shown at the center of the funnel. Since the advection is computed adaptively, the sparseness of streamballs along a path indicates lower stream vorticity while "bunching" of streamballs indicates higher stream vorticity. Compared to the images above, the tornado core has the highest stream vorticity. |
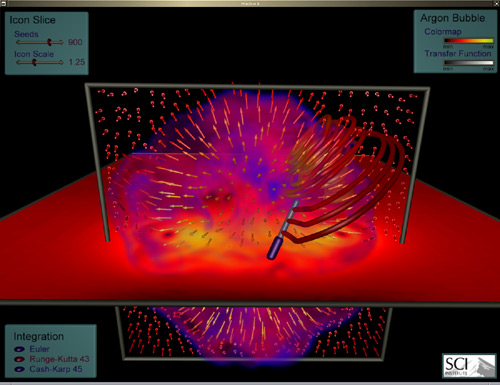
Argon Bubble Visualization
The dataset visualized here is a single timestep from a shockwave physics simulation. A bubble of Argon gas surrounded by air is impacted by a Mach 1.25 shockwave. Since the density of Argon is higher than that of the surrounding air, the wavefront slows down through the bubble's center as it passes. This causes the edges of the bubble to accelerate relative to the center. Eventually, a hole is torn through the center of the bubble creating a "smoke ring" traveling in the opposite direction of the wavefront. This ring is a torus-shaped vortex that swirls inward from the momentum imparted by the shockwave, leaving a trail of turbulence in its wake.
Several visualization techniques are used to show different characteristics of the data: a slice of field magnitude (horizontal) is rendered as a textured slice, a slice of the velocity field is shown with vector icons (vertical), and volume rendering of density emphasizes the turbulent mixing of Argon with air. A rake probe interactively seeds streamtubes within the velocity field.
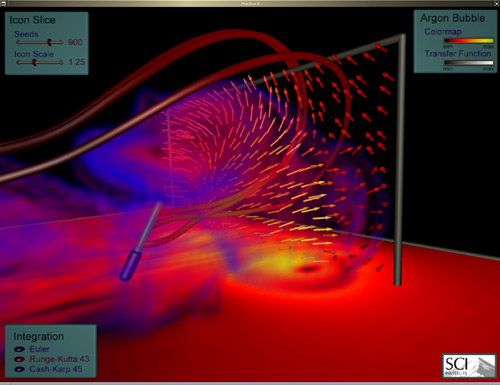
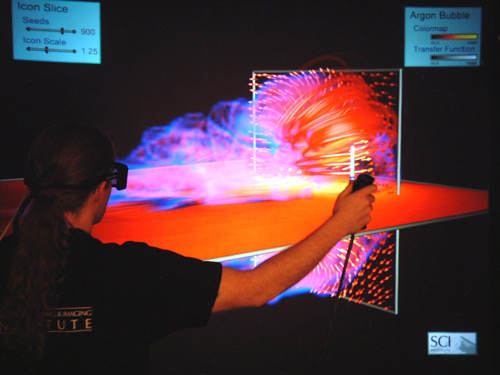 Dean explores the edge of the ring using the VSC Wall Display. At the timestep visualized, the ring is moving away from this rear viewpoint. Notice that the seeded streamtubes have a clockwise direction, which is physically consistent. |
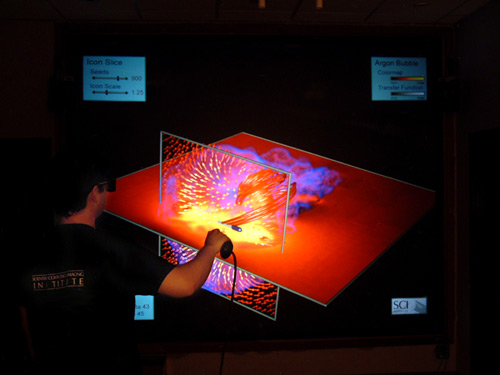 Milan probes around the center of the ring using the VSC Wall Display. Since this is a frontal view, the ring is moving towards the user so the seeded streamtubes have a counterclockwise direction. |
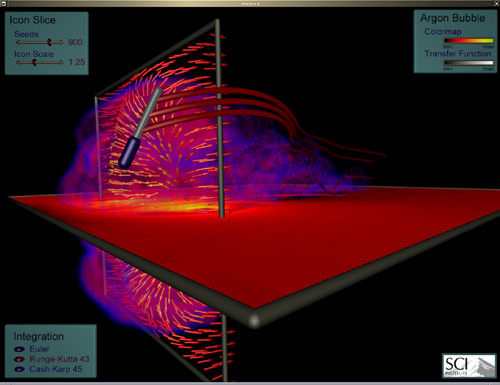
Desktop visualization of the Argon bubble dataset. Here the probe shows that the flow outside of the turbulent ring passes by without entering. Except for some turbulence at the end of one streamtube, the flow continues in the same general direction of the initial shockwave. |
 This image shows that towards the edge of the ring's turbulence, the streamtubes may either spiral into the torus-shaped vortex (above the rake) or pass through it. |
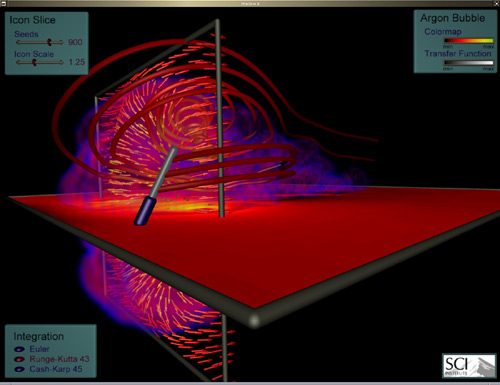
 A frontal view showing that rake seeds in front of the ring spiral into the vortex. |
 A rear three-quarter view showing that rake seeds behind the center of the ring may pass through without being drawn in. |
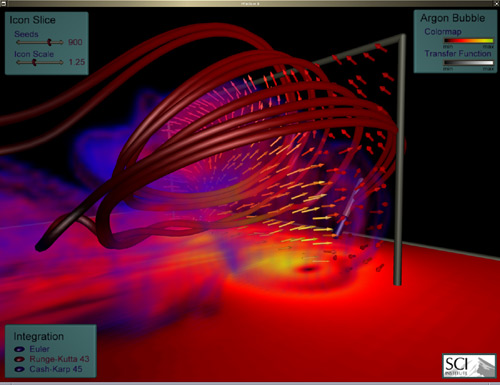 Streamtubes may enter and exit the ring. During their journey, streamtubes may twist, merge, and split. |
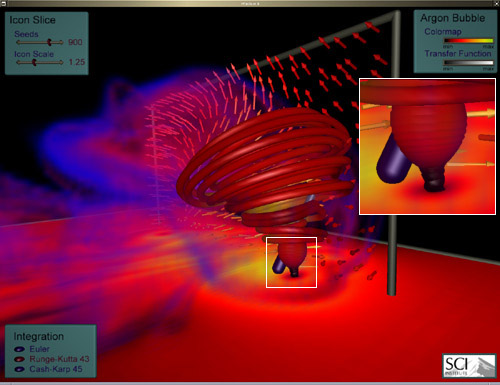 Streamtubes converge onto the low magnitude core of the ring, the proverbial "eye of the storm" (see inset). |