Intensity inhomogeneity is one of the main obstacles for MRI data post processing. The problem requires retrospective correction due to the strong dependence of the inhomogeneity on patient anatomy and the accompanying acquisition protocol. We have developed a new method for correcting the inhomogeneities using a polynomial estimation of the bias field. The method minimizes the composite energy function to find parameters of the polynomial model. The energy function is designed to provide a robust estimation of the bias field by combining measures from histogram analysis and local gradient estimation. The method was validated on a wide range of MRI data obtained with coils of different types and under different acquisition protocols.
The developed method provides reliable estimation of the intensity inhomogeneities in MRI data. The correction times are dependant on the number of parameters the model used, the dataset size and the degree of subsampling in estimation of both local and global terms and vary from 1 to 5 minutes using a mid range PC.
Correction of T1-weighted brain data by 4th order order Legendre polynomials
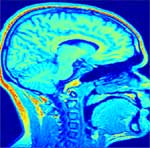 Initial sagital slice of T1-brain dataset |
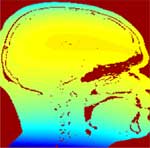 Estimated bias field |
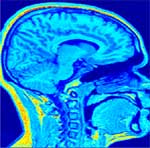 Corrected Slice |
Correction of PD-weighted brain data by 2nd order Legendre polynomials
Figures (left to right, top to bottom):
|
 |
Correction of T2-weighted surface coil brain data by 4th order Legendre polynomials
 Initial "sum-of-squares" slice of T2-wieghted brain data set from 4-surface coils. |
 Corrected slice |
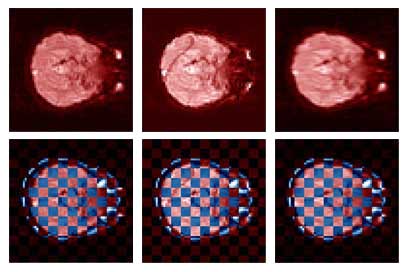
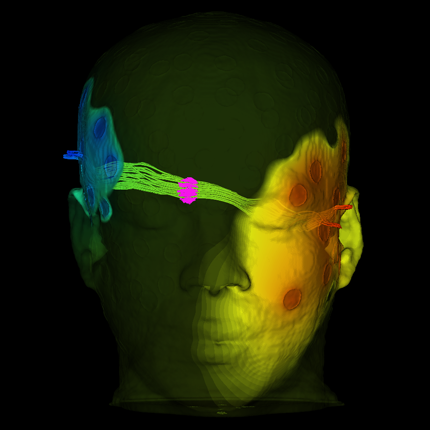
Results of RegMor and Inverse EPI on Brain Data
Thesis work by L. TraynorGlobal and local distortions in echo planar imaging (EPI) are problematic for the clinical and medical imaging research communities. While EPI correction via maps of the magnetic field are the current gold standard, the field map data is not always available. We introduce in this poster a method of EPI correction that uses image registration and morphing (RegMor) along anatomical magnetic resonance scans, instead of field maps, for correction. Correction accuracy of real EP data by RegMor was compared to a field map method for validation. We computed joint entropy from joint histograms of the anatomical and various EPI data sets. To aid in joint entropy analysis, the joint histograms were blurred with the Parzen windowing technique. The width of the kernel was 8x8 and the shape was a Gaussian with a sigma value of 3.
|
|
 Fig 2. Joint entropy plots without Parzen Windowing |
 Fig 3. Joint entropy plots with Parzen Windowing |
| Figure 1 shows the raw and blurred joint histograms. Comparing RegMor to the uncorrected EP scans, average joint entropy over all 22 slices decreased 4% without Parzen windowing and 10% with windowing. The 10% joint entropy decrease is large compared to the field map corrected method that produced only a 1% decrease. | Figures 2 and 3 show the joint entropy results for each slice in the data set without and with Parzen windowing. | |

|
|
|
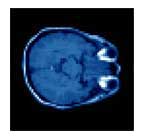
| Figure 4 displays the uncorrected, RegMor corrected, and field map corrected EP scans, in red, merged into a checker board pattern with the blue non-distorted anatomical scan, in Figure 5. In the checker board images, the brain edges from the uncorrected EP scan and anatomical scan are disjointed, while the brain edges of the corrected EP scans and anatomical scans flow evenly into each other. | |