
Visualization
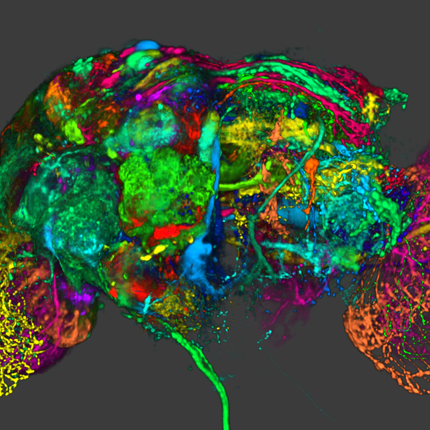
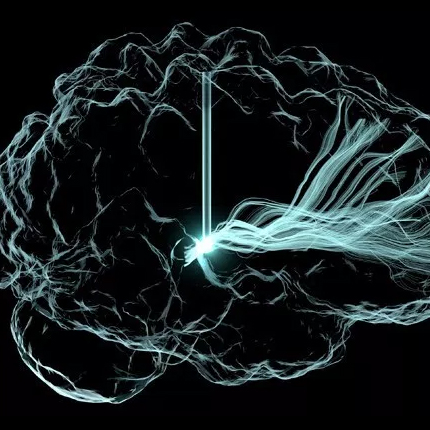
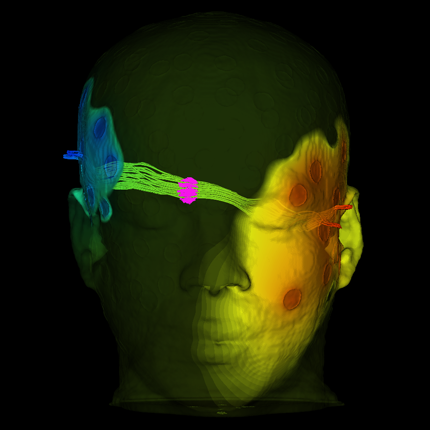
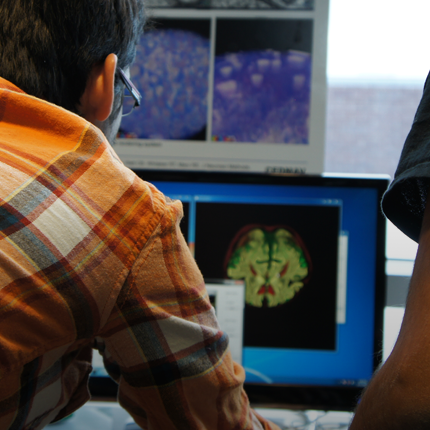
Visualization, sometimes referred to as visual data analysis, uses the graphical representation of data as a means of gaining understanding and insight into the data. Visualization research at SCI has focused on applications spanning computational fluid dynamics, medical imaging and analysis, biomedical data analysis, healthcare data analysis, weather data analysis, poetry, network and graph analysis, financial data analysis, etc.Research involves novel algorithm and technique development to building tools and systems that assist in the comprehension of massive amounts of (scientific) data. We also research the process of creating successful visualizations.
We strongly believe in the role of interactivity in visual data analysis. Therefore, much of our research is concerned with creating visualizations that are intuitive to interact with and also render at interactive rates.
Visualization at SCI includes the academic subfields of Scientific Visualization, Information Visualization and Visual Analytics.


Mike Kirby
Uncertainty Visualization

Alex Lex
Information Visualization
Centers and Labs:
- Visualization Design Lab (VDL)
- CEDMAV
- POWDER Display Wall
- Modeling, Display, and Understanding Uncertainty in Simulations for Policy Decision Making
- Topological Data Analysis for Large Network Visualization
Funded Research Projects:
Publications in Visualization:
  A Note on Dynamic Data Driven Application Simulation (DDDAS) Using Virtual Telemetry C.C. Douglas, C.E. Shannon, Y. Efendiev, R.E. Ewing, V. Ginting, R. Lazanov, M.J. Cole, G.M. Jones, C.R. Johnson, J. Simpson. In International Conference on Parallel Algorithms and Computing Environments, pp. pp.193--198. 2003. |
| Geometric Surface Smoothing via Anisotropic Diffusion of Normals T. Tasdizen, R.T. Whitaker, P. Burchard, S. Osher. In Proceeding of IEEE Visualization 2002, pp. 125--132. 2002. |
| The transfer function bake-off H. Pfister, B. Lorensen, C. Bajaj, G. Kindlmann, W. Schroeder, L.S. Avila, K.M. Raghu, R. Machiraju, J. Lee. In IEEE Computer Graphics and Applications, Vol. 21, No. 1, IEEE, pp. 16--22. 2001. DOI: 10.1109/38.920623 |
Modeling and Simulation in Medicine: Towards an Integrated Framework G. Higgins, B. Athey, J. Bassingthwaighte, J. Burgess, H. Champion, K. Cleary, P. Dev, J. Duncan, M. Hopmeier, D. Jenkins, C.R. Johnson, H. Kelly, R. Leitch, W. Lorensen, D. Metaxas, V. Spitzer, N. Vaidehi, K. Vosburgh, R. Winslow. In Computer Aided Surgery, Vol. 6, No. 1, Note: Final report of the meeting of the same title held July 20-21, 2000, National Library of Medicine, National Institutes of Health, Bethesda, Maryland, USA., 2001. DOI: 10.1002/igs.1008 |
| Computational Engineering and Science Program at the University of Utah C. DeTar, A.L. Fogelson, C.R. Johnson, C.A. Sikorski. In Proceedings of the International Conference on Computational Science (ICCS) 2001, San Francisco, Edited by V. Alexandrov and J. Dongarra and B. Juliano and R. Renner and K. Tan, pp. 1176--1185. May, 2001. |
  A Prototype System For Synergistic Data Display J.D. Brederson, M. Ikits, C.R. Johnson, C.D. Hansen. In IEEE Virtual Reality 2001, 2001. |
| Computational Field Visualization C.R. Johnson, D. Brederson, C.D. Hansen, M. Ikits, G. Kindlmann, Y. Livnat, S.G. Parker, D.M. Weinstein, R.T. Whitaker. In Computer Graphics, Vol. 35, No. 4, pp. 5--9. 2001. |
| Isosurface extraction for large-scale datasets Y. Livnat, C.D. Hansen, S.G. Parker, C.R. Johnson. In Proceedings of Scientific Visualization -Dagstuhl`2000, Edited by F. Post, 2001. |
Quantitative Comparative Evaluation of 2D Vector Field Visualization Methods D.H. Laidlaw, R.M. Kirby, J.S. Davidson, T.S. Miller, M. da Silva, W.H. Warren, M. Tarr. In Proceedings of IEEE Visualization 2001, San Diego, CA, pp. 143--150. October, 2001. |
|
Topology Preserving Smoothing of Vector Fields R. Westermann, C.R. Johnson, T. Ertl. In IEEE Trans. Vis & Comp. Graph., Vol. 7, No. 3, pp. 222--229. 2001. DOI: 10.1109/2945.942690 Proposes a technique for topology-preserving smoothing of sampled vector fields. The vector field data is first converted into a scalar representation in which time surfaces implicitly exist as level sets. We then locally analyze the dynamic behavior of the level sets by placing geometric primitives in the scalar field and by subsequently distorting these primitives with respect to local variations in this field. From the distorted primitives, we calculate the curvature normal and we use the normal magnitude and its direction to separate distinct flow features. Geometrical and topological considerations are then combined to successively smooth dense flow fields, at the same time retaining their topological structure. Keywords: vector field methods, ip image processing signal processing, surface processing, ncrr |
| Dynamic Data Driven Application Systems: Creating a dynamic and symbiotic coupling of application/simulations with measurements/experiments A. Deshmukh, C.C. Douglas, M. Ball, R.E. Ewing, C.R. Johnson, C. Kesselman, C. Lee. Note: 28 pages, Edited by W. Powell, R. Sharpley, National Science Foundation, 2000. |
| Statistical Analysis For FEM EEG Source Localization in Realistic Head Models School of Computing Technical Report, L. Zhukov, D. Weinstein, C.R. Johnson. No. UUCS-2000-003, University of Utah, February, 2000. |
| The Visual Haptic Workbench J.D. Brederson, M. Ikits, C.R. Johnson, C.D. Hansen, J.M. Hollerbach. In Proceedings of the Fifth PHANToM Users Group Workshop, pp. 46--49. October, 2000. |
| Fast Isosurface Extraction Methods for Large Image Data Sets Y. Livnat, S.G. Parker, C.R. Johnson. In Handbook of Medical Imaging, Edited by A.N. Bankman, Academic Press, San Diego, CA pp. 731--745. Nov, 2000. |
| A Level-Set Method for Flow Visualization R. Westermann, C.R. Johnson, T. Ertl. In Proceeding of IEEE Visualization 2000, IEEE Computer Society, Salt Lake City pp. 147--154. 2000. |
| An Inverse EEG Problem Solving Environment and its Applications to EEG Source Localization D.M. Weinstein, L. Zhukov, C.R. Johnson. In NeuroImage (suppl.), pp. 921. 2000. |
| Computational Steering and the SCIRun Integrated Problem Solving Environment S.G. Parker, M. Miller, C.D. Hansen, C.R. Johnson. In Proceedings of Dagstuhl 1997 Workshop on Scientific Visualization, Note: Invited and peer reviewed, Edited by Hans Hagen and Greg Nielson and Frits Post, pp. 257--266. 2000. |
Immersive Virtual Reality for Visualizing Flow Through an Artery A. Forsberg, R.M. Kirby, D.H. Laidlaw, G.E. Karniadakis, A. van Dam, J. Elion. In Proceedings of IEEE Visualization 2000, Salt Lake City, UT, pp. 457--460. October, 2000. |
Interactive Source Imaging with BioPSE D.M. Weinstein, L. Zhukov, C.R. Johnson, S.G. Parker, R. Van Uitert, R.S. MacLeod, C.D. Hansen. In Chicago 2000 World Congress on Medical Physics and Biomedical Engineering, Chicago, IL., Note: Refereed abstract., July, 2000. |
| Large-Scale Computational Science Applications Using the SCIRun Problem Solving Environment C.R. Johnson, S.G. Parker, D. Weinstein. In Proceedings of The International Supercomputer Conference 2000, 2000. |